A Basic Overview for Emerging Physician and Medical Professional Investors
By Somnath Basu; PhD, MBA
There are three basic considerations in any investment decision.
1] The first is the understanding of the investment objective or why the investment is being made. While this may seem somewhat irrelevant at first – why would you be investing if you do not know what you are doing – combining investment objectives can pose problems down-stream.
For example, if you are saving for your retirement so that you can afford the retirement lifestyle you desire (the investment objective), your saving plan should not include any savings you are making for your children’s education (a separate investment objective). Compounding the two savings streams in one plan can very easily lead to one or both of the plans failing.
2] The second consideration is the time horizon of the investment. As a rough guide, investments that need to mature in the next 5-7 years can be considered as short term, 8-15 years as medium term and the rest as long term.
3] Finally, and probably the most important consideration of all is the importance you attach (priority) to achieving your investment objective; in other words, how safe and secure should your investments be. For example, if you are 70 years old and considering how you should invest your retirement funds so that your expenses are covered say for the next 25 years, you do not want a large margin of error in how your investments turn out; you can ill afford to be broke when you are older and hence you want your investments to be as secure as possible.
On the other hand, if the investment is for a second home or a boat, for example, you may wish to engage in some risk taking which may help in lowering your upfront investment needs. It is very important for any investor to clearly understand how much loss they can bear from any investment decision.
Decision Matrix
It is useful to express the investment framework described above as a simple decision matrix. Using the matrix (shown below) as a decision support system should clarify and simplify most investment decisions.
Link: Investment Scenarios
Understanding where in the matrix your decision falls is a very good first step of your decision. Both these elements (safety and time) will ultimately decide the kinds of financial instruments that will reside in your portfolio. We will examine the structure of each of the 9 possible combinations shown in the matrix. Before doing so, let us start by examining the various investment alternatives (e.g. stocks, bonds, etc.) since they have an implicit connection with the two dimensions portrayed in our matrix.
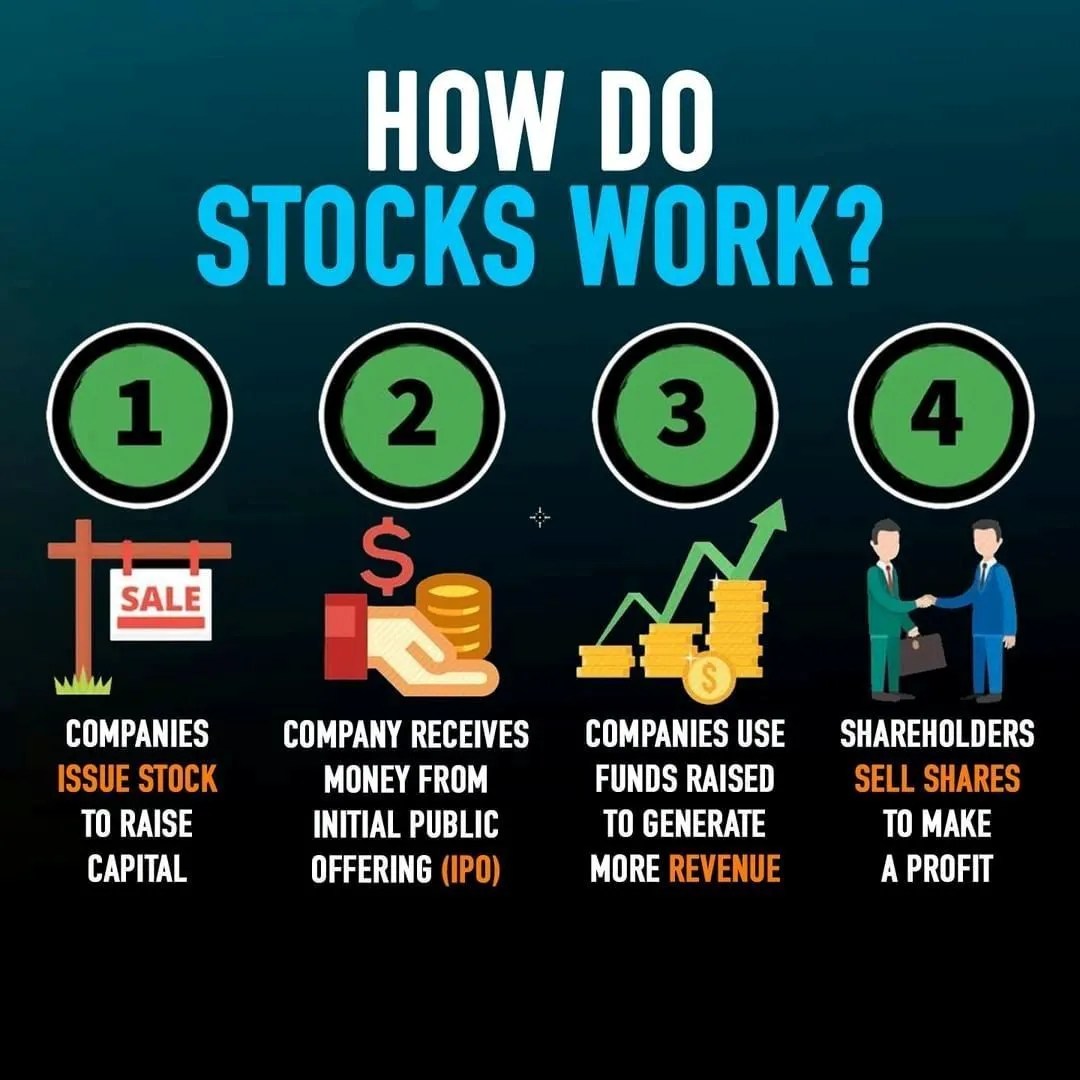
Stocks
Stocks are the most well known and popular form of financial investments. Stocks may be further segregated between large cap and small cap stocks, where the term “cap” is surrogate for the size of the underlying corporation or firm.
Stocks may represent investments in both domestic and international companies. Within the international category, stocks may represent corporations registered in developed (safer) or emerging (riskier) markets. In terms of our matrix dimensions, stocks are best suited when the decision is of medium or long term. In terms of safety, large cap (both domestic and international) stocks are the safest, while small cap and emerging market stocks are the most risky. The riskier the stock, the greater are the profit possibilities as are the chances of large losses.
Bonds
The second common type of investment are bonds Generally, bonds are much safer than stocks with the exception of a class of bonds known as high yield (or junk) bonds. Bonds are issued by companies, governments (domestic and international) and other agencies such as local governments (municipal bonds or “munis” which are especially desirable for those in high income tax rate categories) and quasi-government agencies such as Federal Home Loan Bank, Student Loan Administration, Agricultural Cooperative Banks, etc (collectively known as “Agency” bonds such as Ginnie/Fannie/Sallie Mae, Freddie Mac, etc.).
Government bonds are the safest, followed by agency and municipal bonds and then by bonds issues by corporations.
Corporate bonds may be safe (which are assigned credit safety ratings such as AAA, AA, BBB, etc.) or risky (junk bonds with ratings such as BB, CCC, CC etc.).
Bonds can be used for all time horizons, their maturities ranging from 3 months to 30 years. Very short term bond and bond like instruments (with maturities of one year or less) are known as money market securities which are generally safer than most other investments.
Alternate Investments
Other types of investments include real estate (long term, risky), commodities (such as energy, basic building materials, precious metals, etc.) which are also risky and which may be used for both short term and long term purposes and provide a good hedge (counter balance) in an inflationary environment, derivatives (options and futures) which are very risky and typically short term in nature. Derivatives are generally suggested for very sophisticated investors and are best left alone otherwise.
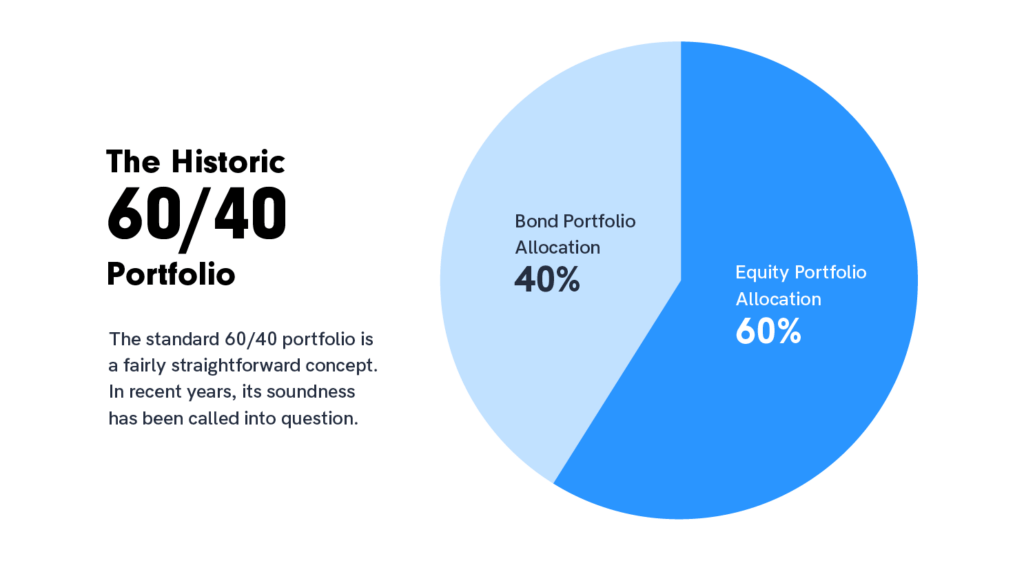
Risk Reduction
A very important feature about investments is that when various types of investments are bundled together in a portfolio, they help to reduce the risk of the investment decision without affecting the profits in a comparable way. This basic aspect of mixing various kinds of investments (stocks, bonds, etc) to reduce risk is known as diversification and it is a “must” for any investment portfolio. It is a “must” because this technique of risk reduction is generally costless (unless you are paying a financial advisor to do this for you) and it is very worthwhile. All other methods of risk reduction have cost implications.
Scenario Matrix
Armed with this nomenclature regarding various investment types we can now go about examining what the 9 combination (Scenario) portfolios may look like for investment purposes.
Link: Investment Scenarios
Starting with Scenario 1, if you wish to make a short term decision that is very important to you and needs to be very safe, investments should be made in very short term bonds (government or treasury bills)and other similar money market (short term, safe) securities. International short term bonds of developed countries may also be included. Such investment products are generally available through mutual funds or Exchange Traded Funds (or ETFs). ETFs are just like mutual funds except that they are usually cheaper, much easier to buy and sell and may provide tax deferral benefits.
If your investment falls in the Scenario 2 category, include agency/municipal bonds as well as some domestic and international (developed country) large cap stocks while for Scenario 3, smaller portions of small cap and emerging market stocks may be added proportionately while reducing some of the safer investments.
If your investment was a Scenario 4 type of investment, corporate large cap stocks (both domestic and international) could be added to agency or corporate (domestic and international) bonds. Before investing in stocks (in any Scenario) for this Scenario 4, a good question to ask is the following: how profitable were stock investments in the last 3-5 years? If the answer is “very profitable” then reduce the proportion of stocks as compared to bonds in the portfolio. If the last few years were not good, then it would be good to increase their comparable shares. The main reason for this “fine tuning” is that the fortunes of stocks (and many other types of investments) follow a cyclical pattern and the cycle is related to the general cycle of economic (GDP) growth and contraction.
It can be seen now how Scenarios 5 and 6 (as also 8 and 9) will follow a similar pattern as before, increasing proportionally in stocks (of all sizes, domestic/international), real estate, commodities, etc. Portfolios falling in these groups may also include some small cap and emerging market stocks as well as high yield or junk bonds. The proportion of these riskier investments would of course be higher for Scenario 6 over Scenario 5 (and Scenario 9 over 8).
For Scenario 7, the investment portfolio would typically resemble one that would be like an opposite of the portfolio in Scenario 1 and would include a greater proportion of large cap (domestic/international) stocks and a much smaller proportion of bonds. As we move towards Scenarios 8 and 9, the portfolios would be dominated by small cap and emerging market stocks as well as junk bonds.
Assessment
In the discussion above, I have tried to generalize the investment decision in a simplifying way. While the discussion may have centered more on stocks and bonds, it is important to note that all portfolios must “diversify” the investment risks by expanding upon the various types of investment products contained in the portfolios. The very fact that a portfolio contains various types of investments will ensure that the portfolio will perform better than those which are not as well diversified. This will be so in spite of any one of the investment types underperforming at any point in time and the diversification benefit will be received consistently over long periods of time. A popular analogy to this diversification benefit is the common phrase of not putting all eggs in one basket.

Editor’s Note: Somnath Basu PhD is program director of the California Institute of Finance in the School of Business at California Lutheran University where he’s also a professor of finance. He can be reached at (805) 493 3980 or basu@callutheran.edu
Conclusion
The above approach to investment decision-making can be considered as a basic template that can be used universally. For those seeking greater sophistication and who have a foundation built on the above model, expert advice is strongly recommended.
And so, your thoughts and comments on this ME-P are appreciated. Financial advisors please chime in on the debate? Is Basu correct; why or why not? Review our top-left column, and top-right sidebar materials, links, URLs and related websites, too. Then, be sure to subscribe to the ME-P. It is fast, free and secure.
Link: http://feeds.feedburner.com/HealthcareFinancialsthePostForcxos
Speaker: If you need a moderator or speaker for an upcoming event, Dr. David E. Marcinko; MBA – Publisher-in-Chief of the Medical Executive-Post – is available for seminar or speaking engagements. Contact: MarcinkoAdvisors@outlook.com
Subscribe Now: Did you like this Medical Executive-Post, or find it helpful, interesting and informative? Want to get the latest ME-Ps delivered to your email box each morning? Just subscribe using the link below. You can unsubscribe at any time. Security is assured.
Sponsors Welcomed
And, credible sponsors and like-minded advertisers are always welcomed.
Link: https://healthcarefinancials.wordpress.com/2007/11/11/advertise
***
Filed under: "Ask-an-Advisor", Investing, Portfolio Management | Tagged: Basu, bonds, ETFs, finance, Investing, Mutual Funds, Portfolio Management, stocks | 3 Comments »