DAILY UPDATE: GDP Worries as Markets Stumble with Meta but other Technology Stocks are Good

MEDICAL EXECUTIVE-POST TODAY’S NEWSLETTER BRIEFING

***

Essays, Opinions and Curated News in Health Economics, Investing, Business, Management and Financial Planning for Physician Entrepreneurs and their Savvy Advisors and Consultants

Serving Almost One Million Doctors, Financial Advisors and Medical Management Consultants Daily

A Partner of the Institute of Medical Business Advisors , Inc.

http://www.MedicalBusinessAdvisors.com

SPONSORED BY: Marcinko & Associates, Inc.

***

http://www.MarcinkoAssociates.com

Daily Update Provided By Staff Reporters Since 2007.
How May We Serve You?
© Copyright Institute of Medical Business Advisors, Inc. All rights reserved. 2024

REFER A COLLEAGUE: MarcinkoAdvisors@msn.com

SPONSORSHIPS AVAILABLE: https://medicalexecutivepost.com/sponsors/

ADVERTISE ON THE ME-P: https://tinyurl.com/ytb5955z

***

New GDP numbers out yesterday show a worrying combo of stubborn inflation + waning growth that dampens hopes for a potential interest rate cut. Per the latest data from the Bureau of Economic Analysis, the first quarter of 2024 was a confounding one:

  • GDP increased at a 1.6% annualized rate, far below projections of 2.4% and notably down from 3.4% at the end of 2023.
  • While slow growth would typically signal that the Fed could cut rates, another metric complicates matters: Consumer prices (excluding volatile categories), a solid indicator of inflation, shot up to a much higher than anticipated 3.7%.

***

Meta reported record Q1 revenue yesterday, but it was overshadowed by the billions of dollars the company is spending in its efforts to win the Artificial Intelligence race and make the Metaverse happen. Investors were unhappy with the company’s forecast that its spending will rise by $10 billion dollars to support Artificial Intelligence development, sending Meta’s stock price down 15% after hours.

Here’s where the major benchmarks ended:

  • The S&P 500 index fell 23.21 points (0.5%) to 5,048.42; the Dow Jones Industrial Average lost 375.12 points (1.0%) to 38,085.80; the NASDAQ Composite® ($COMP) shed 100.99 points (0.6%) to 15,611.76.
  • The 10-year Treasury note yield (TNX) rose about 5 basis points to 4.704%.
  • The CBOE Volatility Index® (VIX) fell 0.64 to 15.33.

Communication services shares were the weakest S&P 500 sector Thursday behind the plunge in Meta Platforms. Late Wednesday, the Facebook parent provided lighter-than-expected second-quarter revenue guidance, while CEO Mark Zuckerberg discussed spending in currently unprofitable pursuits such as artificial intelligence (AI) and mixed reality. Meta’s first-quarter earnings and revenue both came above analysts ‘ estimates, however.

Meta’s slump helped send the S&P 500 Communication Services index ($SP500#50) down 4%. Banks were also particularly soft amid concern that persistently high interest rates may compress lender margins. Semiconductor and transportation shares were among the few pockets of strength.

CITE: https://www.r2library.com/Resource

But, Alphabet, Microsoft, and Snap reported Q1 earnings yesterday, and were generally good. Alphabet issued its first-ever dividend and authorized $70 billion in stock buybacks, after it beat Wall Street’s revenue expectations. Microsoft also beat revenue forecasts on the strength of its cloud services. And Snap shares soared after it topped estimates and impressed investors with its 422 million global daily active users. It was a much-needed boost for the sector after Meta spooked the market with how much it’s spending on AI.

CITE: https://tinyurl.com/tj8smmes

COMMENTS APPRECIATED

PLEASE SUBSCRIBE: MarcinkoAdvisors@msns.com

Thank You

***

***

***

***

EDUCATIONAL TEXTBOOKS: https://tinyurl.com/4zdxuuwf

***

DAILY UPDATE: U.S. GDP and Microsoft

By Staff Reporters

***

***

The US GDP grew 3.3% in Q4, per the Commerce Department, annihilating Wall Street’s expectations of 2% growth. For the year, the US economy expanded 2.5% in 2023, up from 1.9% in 2022. That also outpaced Wall Street’s estimates from the beginning of the year. The growth was driven by strong consumer spending made possible by rising wages and a sturdy job market, even as the country dealt with inflation. That, too, improved in Q4: Prices increased 2.7% on an annual basis, down from a 5.9% increase the year prior. The GDP smash adds more fuel to the expectation that the Fed will cut interest rates this year.

The cuts across Xbox and Activision Blizzard account for 8% of Microsoft’s video game division. The tech giant closed on its $69 billion acquisition of Call of Duty-maker Activision Blizzard in October and has since made several leadership changes. CEO Bobby Kotick stepped down in December, and now Blizzard President Mike Ybarra has decided to leave, according to an internal memo obtained by The Verge. An upcoming survival game has also been canceled. The cuts come as several gaming-related companies, including Twitch, Discord, Unity, and Riot Games, have conducted layoffs.

CITE: https://www.r2library.com/Resource

***

***

COMMENTS APPRECIATED

Thank You

***

***

HEALTHCARE: Spending Grew in 2022

By Health Capital Consultants, LLC

***

***

On December 13, 2023, the Centers for Medicare & Medicaid Services (CMS) released its annual report on healthcare spending in the U.S., highlighting the growth in private insurance and Medicaid spending in 2022, which was offset by the declines in supplemental federal funding as a result of the COVID-19 pandemic.

CITE: https://www.r2library.com/Resource/Title/082610254

This Health Capital Topics article reviews the notable healthcare spending findings in CMS’s report. (Read more…) 

COMMENTS APPRECIATED

Thank You

***

***

DAILY UPDATE: Pfizer Revises amid US Economic Growth as the Stock Markets Plummet

By Staff Reporters

***

Pfizer, a key producer of the COVID-19 vaccine, has revised its earnings outlook for 2023, cutting its projected earnings per share and revenue estimates. Pfizer saw its 2022 revenue surpass a record $100 billion as company CEO Albert Bourla vowed that everyone will have a “perfectly normal life with just injection maybe once a year.” Bourla received a 36% pay hike and netted $33 million through the pandemic.

***

***

The U.S. economy grew at its fastest pace in nearly two years in the third quarter as higher wages from a tight labor market helped to power consumer spending, again defying dire warnings of a recession that have lingered since 2022. Gross domestic product increased at a 4.9% annualized rate last quarter, the fastest since the fourth quarter of 2021, the Commerce Department’s Bureau of Economic Analysis said in its advance estimate of third-quarter GDP growth. Economists polled by Reuters had forecast GDP rising at a 4.3% rate.

CITE: https://www.r2library.com/Resource

Here is where the major benchmarks ended:

  • The S&P 500® Index (SPX) was down 49.54 points (1.2%) at 4,137.23; the Dow Jones Industrial Average (DJI) was down 251.63 points (0.8%) at 32,784.30; the NASDAQ Composite was down 225.62 points (1.8%) at 12,595.61.
  • The 10-year Treasury note yield (TNX) was down about 11 basis points at 4.845%.
  • CBOE’s Volatility Index (VIX) was up 0.49 at 20.68.

Energy shares were among the weakest-performing sectors Thursday after a larger-than-expected increase in U.S. oil inventories last week sent WTI crude futures down more than 2% to a two-week low. Communication services and technology were also lower.

The market’s overall weakness belied some notable pockets of strength, including in banks and utilities, as the KBW Regional Banking Index (KRX) jumped more than 3%. Small-caps offered possible signs that a recent steep downdraft may be waning, with the Russell 2000 Index (RUT) dropping to a 12-month low earlier in the day before recovering to close about 0.7% higher.

***

COMMENTS APPRECIATED

Thank You

***

***

U.S. ECONOMY: “Soft Landing” Humming Along

By Staff Reporters

***

***

US gross domestic product (GDP) increased at a more-than-expected 2.4% annualized rate last quarter thanks to healthy consumer spending and businesses shelling out on investments. The latest figures show that not only is the US economy not spiraling into a recession due to interest rate hikes, it’s actually getting stronger as the year goes on.

In fact, underlying inflation rose at its slowest pace in two years. This could be a sign of the “soft landing” that FOMC Chair Jerome Powell seeks.

***

The European Central Bank also took it a cue from the FOMC and raised interest rates to a 23-year high. Investors think it could be the ECB’s last rate hike this cycle.

***

But, according to CNN, Japan’s central bank kept interest rates unchanged today despite rising inflation but hinted that it could gradually abandon years of cheap money, sending the yen soaring and stocks tumbling. The Bank of Japan (BOJ) said it kept unchanged its short-term interest rate at minus 0.1% and maintained its target for the yield on 10-year government bond at around 0%.

But the central bank also said it would adopt a more flexible approach to controlling the yield on government bonds — which affects borrowing costs across the world’s third biggest economy,diluting a key pillar of its longstanding ultra-loose monetary policy.

***

After a historic 13-day winning streak, the Dow—along with the other two major indexes—closed lower as its dizzying rise finally succumbed to gravity. There were some strong individual performances, however. Meta kept its impressive 2023 rolling after giving an optimistic earnings report.

***

COMMENTS APPRECIATED

Thank You

***

***

Is the ARK Sinking?

By Staff Reporters

***

  • Markets: Stocks are rolling following a week that showed our inflation emergency seems to be ending, and big banks are still raking in big profits. The Fed’s so-called “soft landing” scenario—getting inflation down without tipping the economy into a recession—is a distinct possibility, as long as corporate finances don’t end up being shockingly bad this earnings season.
  • Global economy: While the US economy is chugging along, the same can’t be said for China. Growth in the world’s No. 2 economy hardly budged between the first and second quarters, while youth unemployment hit a record last month. Expect President Xi Jinping to make moves to juice China’s stagnating GDP.

***

***

Curiously, Cathie Wood’s flagship exchange-traded fund has rallied more than 50% this year. Investors are using that as an opportunity to get out. 

They have pulled a net $717 million from the ARK Innovation ETF over the past 12 months, according to FactSet. That exodus marks a notable shift for a fund that had consistently drawn investor cash since its 2014 inception. Once the largest actively managed ETF with nearly $30 billion in assets under management, the fund has shrunk to roughly $9 billion, mostly due to investment losses. 

Known by its ticker symbol ARKK, Wood’s fund became an investor darling shortly after the onset of the Covid-19 pandemic with hugely successful bets on unprofitable and “disruptive” technology companies. It took in huge amounts of investor money, culminating with a $6.5 billion inflow in the first quarter of 2021, when its share price peaked.

Then, the Federal Reserve’s fastest interest-rate hiking campaign in decades crushed the valuations of unprofitable growth companies, which often attract investors when interest rates are low and returns on safer investments such as CDs are minimal. Shares of ARKK plunged 67% in 2022, but its investors largely held on or bought the dip.

Now, analysts say they expect some of those investors are getting out for good?  

MORE: https://medicalexecutivepost.com/2023/07/12/from-active-to-passive-investing/

***

COMMENTS APPRECIATED

Thank You

***

***

CMS: Projected National Health Expenditures to Surpass $7 Trillion Dollars

By Health Capital Consultants, LLC

***

***

Projected National Health Expenditures to Surpass $7 Trillion

On June 14th, 2023, CMS released health insurance enrollment and national health expenditure (NHE) projections for 2022 through 2031.

CITE: https://www.r2library.com/Resource

The NHE, which is published annually, is the official U.S. estimate of insurance enrollment and health spending. CMS projects that from 2022 to 2031, the NHE’s annual growth rate of 5.4% will surpass the U.S. gross domestic product (GDP) annual growth rate of 4.6%. As a result, health spending as a share of the U.S. GDP is set to jump from 18.3% in 2021 to 19.6% in 2031.

This Health Capital Topics article will review the notable findings from CMS’s projection report. (Read more…) 

COMMENTS APPRECIATED

Thank You

***

***

DAILY UPDATE: Stocks Rise with Economic Data

By Staff Reporters

***

***

Q4’s strong GDP numbers are raising hopes that the Fed could actually pull off the tricky “soft landing”—where it knocks down inflation through interest rate hikes without sending economic growth into reverse. The resilient labor market is cooperating: Despite all the headlines about layoffs, jobless claims fell last week to their lowest point since April 2022.

CITE: https://www.r2library.com/Resource/Title/0826102549

***

U.S. stocks ended the day in the green as the markets digested a host of economic and earnings data. The economic calendar came in heavy today, as Q4 GDP growth was higher than expected, jobless claims unexpectedly fell, new home sales rose, and durable goods orders jumped, but dipped when stripping out the volatile component of transportation activity. Several Dow members were in focus, as IBM exceeded expectations, though its cash flow performance garnered some scrutiny on the Street, and Dow Inc. missed quarterly estimates. Fellow Dow component Chevron announced an increased dividend and a new $75.0 billion share repurchase plan, while in other news, Tesla topped quarterly estimates and offered an upbeat outlook.

Treasury yields traded mostly higher, and the U.S. dollar advanced, while crude oil prices increased, and gold moved to the downside.

Asian stocks finished mixed in lighter volume as several markets remained closed for holidays, while markets in Europe were higher for the most part, adding to the region’s strong start to the year.

***

ORDER: https://www.routledge.com/Comprehensive-Financial-Planning-Strategies-for-Doctors-and-Advisors-Best/Marcinko-Hetico/p/book/9781482240283

***

COMMENTS APPRECIATED

Thank You

***

What is STAGFLATION?

By Staff Reporters

***

***

What Is Stagflation?

Stagflation is characterized by slow economic growth and relatively high unemployment—or economic stagnation—which is at the same time accompanied by rising prices (i.e., inflation). Stagflation can be alternatively defined as a period of inflation combined with a decline in the gross domestic product (GDP).

CITE: https://www.r2library.com/Resource/Title/0826102549

The term, a portmanteau of stagnation and inflation, is generally attributed to Iain Macleod, a British Conservative Party politician who became Chancellor of the Exchequer in 1970.

MORE: https://medicalexecutivepost.com/2019/06/25/what-is-a-portmanteau/

Key Takeaways According to Investopedia

  • Stagflation refers to an economy that is experiencing a simultaneous increase in inflation and stagnation of economic output.
  • Stagflation was first recognized during the 1970s when many developed economies experienced rapid inflation and high unemployment as a result of an oil shock.1
  • The prevailing economic theory at the time could not easily explain how stagflation could occur.
  • Since the 1970s, rising price levels during periods of slow or negative economic growth have become somewhat of the norm rather than an exceptional situation.

***

COMMENTS APPRECIATED

Thank You

***

FINANCE: https://www.amazon.com/Comprehensive-Financial-Planning-Strategies-Advisors/dp/1482240289/ref=sr_1_1?ie=UTF8&qid=1418580820&sr=8-1&keywords=david+marcinko

***

Recognizing the Differences between Healthcare and Other Industries

Join Our Mailing List

Why Hospitals, Clinics and Medical Offices are Not Hotels, or Manufacturing Plants or Production Assembly Lines, etc.

By Dr. David E. Marcinko FACFAS, MBA, CMP™

[Editor-in-Chief]

The rising cost of health insurance remains a major concern for business; despite the Affordable Care Act [ACA] of March 2010. Local and national news publications have trumpeted that healthcare costs are not just rising but are growing in proportion to the cost of other goods and services.

Many of these publications have expressed the widely held view that because of the “inflation gap,” the cost of medical expenses needs curbing.  Proponents of this viewpoint attribute the growth in the gross domestic product (GDP) devoted to personal medical services (from 5% in 1965 to approximately 14% in 2005 and 17% in 2012) to increases in both total national medical expenditures as well as prices for specific services, and then conclude that there is a need to rein in the growing costs of healthcare services for the average American, even if it be through a legislative mandate.

Healthcare Is the Economy

According to colleague Robert James Cimasi MHA, AVA, CMP™ of Health Capital Consultants LLC in St. Louis, MO, healthcare cannot be separated from the economy at large. Although economists have cited the aging population as the reason for the increase in healthcare’s share of the GDP, other voices assert that financial greed among HMOs, pharmaceutical companies, hospitals, and medical providers like doctors and nurses is responsible.  In reality, the rise in healthcare expenditures is, at least in large part, the result of a much deeper economic force.

www.CertifiedMedicalPlanner.org

As economist William J. Baumol of New York University explained in a November 1993 New Republic article: “the relative increase in healthcare costs compared with the rest of the economy is inevitable and an ineradicable part of a developed economy. The attempt [to control relative costs] may be as foolhardy as it is impossible”.

Baumol’s observation is based on documented and significant differences in productivity growth between the healthcare sector of the economy and the economy as a whole.

Low Productivity Growth

Healthcare services have experienced significantly lower productivity growth rates than other industry sectors for three reasons, according to Cimasi:

1) Healthcare services are inherently resistant to automation. Innovation in the form of technological advancement has not made the same impact on healthcare productivity as it has in other industry sectors of the economy.  The manufacturing process can be carried out on an assembly line where thousands of identical (or very similar) items can be produced under the supervision of a few humans utilizing robots and statistical sampling techniques (e.g., defects per 1,000 units). The robot increases assembly line productivity by accelerating the process and reducing labor input. In medicine, most technology is still applied in a patient-by-patient manner — a labor-intensive process. Patients are cared for one at a time. Hospitals and physician offices cannot (and, most would agree, should not) try to operate as factories because patients are each unique and disease is widely variable.

2) Healthcare is local. Unlike other labor-intensive industries (e.g., shoe making), healthcare services are essentially local in nature. They cannot regularly be delivered from Mexico, India or Malaysia.  They must be provided locally by local labor.  Healthcare organizations must compete within a local community with low or no unemployment among skilled workers for high quality and higher cost labor.

3) Healthcare quality is — or is believed to be — correlated with the amount of labor expended. For example, a 30-minute office visit with a physician is perceived to be of higher quality than a 10-minute office visit. In mass production, the number of work-hours per unit is not as important a predictor of product quality as the skills and talents of a small engineering team, which may quickly produce a single design element for thousands of products (e.g., a common car chassis).

Assessment

Healthcare suffers a number of serious consequences when its productivity grows at a slower rate than other industries, the most serious being higher relative costs for healthcare services. The situation is an inevitable and ineradicable part of a developed economy.

For example, as technological advancements increase productivity in the computer, and eHR, manufacturing industry, wages for computer industry labor likewise increase. However, the total cost per computer produced actually declines.  But in healthcare (where technological advancements do not currently have the same impact on productivity), wage increases that would be consistent with other sectors of the economy yield a problem: the cost per unit of healthcare produced increases.

Conclusion

Your thoughts and comments on this ME-P are appreciated. Feel free to review our top-left column, and top-right sidebar materials, links, URLs and related websites, too. Then, subscribe to the ME-P. It is fast, free and secure.

Link: http://feeds.feedburner.com/HealthcareFinancialsthePostForcxos

Speaker: If you need a moderator or speaker for an upcoming event, Dr. David E. Marcinko; MBA – Publisher-in-Chief of the Medical Executive-Post – is available for seminar or speaking engagements. Contact: MarcinkoAdvisors@msn.com

OUR OTHER PRINT BOOKS AND RELATED INFORMATION SOURCES:

DICTIONARIES: http://www.springerpub.com/Search/marcinko
PHYSICIANS: www.MedicalBusinessAdvisors.com
PRACTICES: www.BusinessofMedicalPractice.com
HOSPITALS: http://www.crcpress.com/product/isbn/9781466558731
CLINICS: http://www.crcpress.com/product/isbn/9781439879900
BLOG: www.MedicalExecutivePost.com
FINANCE: Financial Planning for Physicians and Advisors

Product DetailsProduct DetailsProduct Details

Product DetailsProduct Details

Product Details

UPDATE: The Domestic GDP, Bond Yield Surge and Stock Market Volatility [VIX]

***

***

By Staff Reporters

***

The U.S. economy reversed course in this year’s first quarter, when it shrank at an annual rate of 1.4% after posting full-year growth of 5.7% in 2021. While many economists believe the first-quarter setback was temporary, it marked the worst quarterly GDP result since the second quarter of 2020, when the pandemic triggered a brief recession.

And, despite a relatively flat result in the latest week, the yield of the 10-year U.S. Treasury bond jumped in March and April, climbing from 1.83% at the start of that two-month period to around 2.89% on Friday. Rising interest rates have eroded bond prices, pushing yields higher.

Finally, the stock market’s relative calm in the first half of April was fleeting, as the past two weeks produced a 47% jump in an index that measures investors’ expectations of short-term volatility. The CBOE Volatility Indexꟷalso known as the VIXꟷrose to an index level of 33.4 on Friday, up from 22.7 on April 15.

CITE: https://www.r2library.com/Resource/Title/082610254

***

COMMENTS APPRECIATED

Thank You

***

***

Historic US Economic GDP Slowdown

Amid Corona Virus Pandemic

By staff reporters

***

***

***

“Medical Management and Health Economics Education for Financial Advisors”

CMP® CURRICULUM: https://lnkd.in/eDTRHex
CMP® WEB SITE: https://lnkd.in/guWSApq

Your thoughts and comments are appreciated.

BUSINESS, FINANCE, INVESTING AND INSURANCE TEXTS FOR DOCTORS:

1 – https://lnkd.in/ebWtzGg

2 – https://lnkd.in/ezkQMfR

3 – https://lnkd.in/ewJPTJs

THANK YOU

***

Macro-Economic Mid-Year Update

Join Our Mailing List

Last Week’s Headlines

By Michael Green [TGA Capital Management]

www.tgacapitalmanagement.com

Businesses are paying more for goods and services as the Producer Price Index increased 0.5% in June, the largest increase in a year, according to the Labor Department. Higher energy costs pushed the increase. Since businesses usually pass on increases in the cost of goods and services, it’s likely consumer prices will increase as well, driving inflation upward.

Here is a mid year economic summary:

  • In fact, consumer prices did increase in June–just not at quite the same rate as producer prices. The Consumer Price Index rose 0.2%, following the same increase in May and a 0.4% gain in April. Over the last 12 months, the CPI has increased 1.0%. Excluding the volatile food and energy components, consumer prices still increased 0.2% in June and 2.3% from a year earlier.
  • Consumers continue to spend as retail sales increased in June, jumping 0.6% from the previous month and 2.7% ahead of last June. This follows a 0.2% (downwardly revised) increase in May. Excluding autos and gas, household spending climbed 0.7% from May. Output excluding autos remained the same as the prior month. This report, coupled with increases in consumer and producer prices, provides optimism for the economy over the summer months.
  • The manufacturing sector experienced a noticeable uptick in June, as industrial production increased 0.6% after falling 0.3% in May. Manufacturing output rose 0.4%, largely due to an increase in motor vehicle assemblies. June’s gain is the largest monthly increase since November 2014.
  • The number of job openings decreased by 345,000 to 5.5 million on the last business day of May, according to the Job Openings and Labor Turnover Survey (JOLTS) report from the Bureau of Labor Statistics. April’s rate was 5.8 million. May’s job openings rate is the lowest of the year. The quits rate was unchanged at 2.0% as workers continue to remain at their present jobs. It’s important to remember that June’s employment situation report showed significant improvement on the labor front.
  • U.S. import prices rose 0.2% in June from May, largely due to a spike in petroleum prices. Exports also increased in June, rising 0.8% following increases of 1.2% in May and 0.4% in April. The 2.4% rise in export prices for the second quarter of 2016 was the largest three-month advance in export prices since the index rose 2.7% between February and May 2011.
  • The Treasury Department reported a $6.3 billion budgetary surplus in June, following May’s $52.5 billion deficit. However, over the first nine months of the fiscal year, the deficit is up almost 27%, at $400.9 billion, over the same period last year ($316.4 billion).
  • Largely influenced by the immediate negative impact of the Brexit vote, the Index of Consumer Sentiment fell from 93.5 in June to 89.5 in July.
  • In the week ended July 9, the advance figure for seasonally adjusted initial unemployment insurance claims remained level at 254,000, unchanged from the prior week’s level. The advance seasonally adjusted insured unemployment rate remained at 1.6%. The advance number for seasonally adjusted insured unemployment during the week ended July 2 was 2,149,000, an increase of 32,000 from the previous week’s revised level.

Conclusion

Your thoughts and comments on this ME-P are appreciated. Feel free to review our top-left column, and top-right sidebar materials, links, URLs and related websites, too. Then, subscribe to the ME-P. It is fast, free and secure.

Speaker: If you need a moderator or speaker for an upcoming event, Dr. David E. Marcinko; MBA – Publisher-in-Chief of the Medical Executive-Post – is available for seminar or speaking engagements. Contact: MarcinkoAdvisors@msn.com

OUR OTHER PRINT BOOKS AND RELATED INFORMATION SOURCES:

Comprehensive Financial Planning Strategies for Doctors and Advisors: Best Practices from Leading Consultants and Certified Medical Planners™

***

A Hospital Industry Outlook for 2013

Join Our Mailing List

One Expert’s Opinion

By Ann Miller RN MHA

[Managing Editor]

The ME-P and nation recently celebrated National Hospital Week for 2013. And so, what better time than now to ask health economist and financial expert Robert James Cimasi MHA, ASA, AVA, CMP for his take on the industry outlook. www.HealthCapital.com

cimasiHistory Background and Overview

The U.S. Healthcare Delivery System is facing what is perhaps its greatest challenge in the expected demand for increased health services from the aging of the “baby-boom” generation, the fastest-growing segment of the population.

The enactment of healthcare reform in March 2010, requiring increased insurance coverage requirements for individuals and employers, will also increase patient demand for hospital inpatient and outpatient services in the coming years.

Hospital Industry 

The hospital industry continues to face many challenges in the changing healthcare environment, including workforce shortages, rising healthcare costs to provide care, and difficulty acquiring needed capital. With consistent financial stresses, hospitals in some areas appear to be struggling.

However, general acute-care hospitals recorded record high profits of $35.2 billion in 2006, an increase of over 20% from 2005.  Total net revenues for general acute-care hospitals were $587.1 billion, resulting in an average profit margin of 6% (the highest since 1997, when the average profit margin was 6.7%).

While the demand for healthcare continues to rise, the site of service also continues to evolve as more procedures are performed on an outpatient basis and by freestanding facilities rather than by inpatient acute care hospitals.  As evidence of this trend, the number of freestanding ambulatory care surgery centers increased from 2,864 in 2000 to 5,197 in 2006.

U.S. healthcare costs are again increasing after their rate of growth slowed in the mid-1990s.

In 2009, total national health expenditures (NHE) in the U.S. grew to $2.5 trillion, a 5.7% increase from 2008.  Meanwhile, the nation’s gross domestic product (GDP) shrank by 1.1%, and as a result, NHE increased from 16.2% to 17.3% of the GDP: the largest one-year increase-in history. Additionally, healthcare spending has been projected to grow to 19.6% by 2016. The potential impact of the 2010 healthcare reform legislation to reduce rising healthcare expenditures is yet uncertain.

According to a 2002 study conducted by the Blue Cross and Blue Shield Association (BCBSA), inpatient costs are responsive to hospital market organization.  Each 1% increase in for-profit hospital market share is associated with a 2% increase in inpatient expenditure per person.  Conversely, each 1% increase in network hospital market share corresponds to a 1% decrease in inpatient expenditures.

Risk Sharing

As healthcare costs again continue to rise faster than inflation in the overall economy in 2013, driven by advances in technology and treatment (as well as the growing baby-boomer population), pressures to reduce costs, such as those included in the ACA will result in a changed paradigm for healthcare delivery.

Reimbursement mechanisms are increasingly designed to control costs and access, and hospitals must continually adjust to deal with increasing pressure to contain reimbursement and utilization levels; ie., share financial risks.

The Marketplace

The healthcare marketplace continues to experience dramatic change as the business of healthcare becomes increasingly competitive, particularly in the outpatient ancillary services arena.  Providers and payors continue to seek to control costs and markets. Legal and regulatory issues also affect change as providers adapt to new opportunities and restrictions.

In particular, there are a wide variety of cost, operational, and regulatory pressures impacting the specialty and surgical hospital industry.

Of course, these pressures are offset by the stable and increasing demand for hospital services, particularly for those hospitals already in operation.

national-hospital-week

Assessment

Bob feels that hospitals that are operationally efficient will continue to be successful within this environment; others will not. How about you?

More: Financial Management Strategies for Hospitals and Healthcare Organizations : Tools, Techniques, Checklists and Case Studies

More: Arkansas Medical News Interviews Dr. Marcinko

Conclusion

Your thoughts and comments on this ME-P are appreciated. Feel free to review our top-left column, and top-right sidebar materials, links, URLs and related websites, too. Then, subscribe to the ME-P. It is fast, free and secure.

Link: http://feeds.feedburner.com/HealthcareFinancialsthePostForcxos

Speaker: If you need a moderator or speaker for an upcoming event, Dr. David E. Marcinko; MBA – Publisher-in-Chief of the Medical Executive-Post – is available for seminar or speaking engagements. Contact: MarcinkoAdvisors@msn.com

OUR OTHER PRINT BOOKS AND RELATED INFORMATION SOURCES:

Health Dictionary Series: http://www.springerpub.com/Search/marcinko

Practice Management: http://www.springerpub.com/product/9780826105752

Physician Financial Planning: http://www.jbpub.com/catalog/0763745790

Medical Risk Management: http://www.jbpub.com/catalog/9780763733421

Hospitals: http://www.crcpress.com/product/isbn/9781439879900

Physician Advisors: www.CertifiedMedicalPlanner.org

Product Details

Understanding the Domestic “Shadow Economy”

Join Our Mailing List 

Is the US Economy Strong OR Not?

By Dr. David Edward Marcinko MBA

www.CertifiedMedicalPlanner.org

Dr David E Marcinko MBARecently, new highs for the DJIA and some better than expected jobs numbers pointed an outward sign of the US  economy’s continued — though sluggish — recovery from the Great Recession.

Workers in the Shadows

But, there may be another explanation for why consumers keep spending more despite higher payroll taxes and more pain at the gas pump.

Edgar Feige PhD Speaks

That reason is a thriving shadow economy, estimated to have reached as much as $2 trillion last year, according to a study (.pdf file) co-written by Edgar Feige, an economist at the University of Wisconsin-Madison.

Assessment

A shadow economy is one where workers turn to employment that pays under-the-table. While that sometimes includes illegal activity, such as drug dealing, much of the shadow economy today appears to be in areas like service work such as babysitting; medicine, eye, foot and dental care; and working construction jobs for cash.

More

Money

Channel Surfing the ME-P

Have you visited our other topic channels? Established to facilitate idea exchange and link our community together, the value of these topics is dependent upon your input. Please take a minute to visit. And, to prevent that annoying spam, we ask that you register. It is fast, free and secure.

Conclusion

And so, are new medical practice business models like retainer and concierge medicine, direct/private pay, or cash care more or less prone to participation in the underground healthcare economy?

Your thoughts and comments on this ME-P are appreciated. Feel free to review our top-left column, and top-right sidebar materials, links, URLs and related websites, too. Then, subscribe to the ME-P. It is fast, free and secure.

Speaker: If you need a moderator or speaker for an upcoming event, Dr. David E. Marcinko; MBA – Publisher-in-Chief of the Medical Executive-Post – is available for seminar or speaking engagements. Contact: MarcinkoAdvisors@msn.com

OUR OTHER PRINT BOOKS AND RELATED INFORMATION SOURCES:

Product Details  Product Details

Building Up to the Fiscal Cliff

Join Our Mailing List

A Historic Review

Fiscal Cliff

Assessment

Doctors, FAs and all ME-P readers. What is your strategy for the fiscal cliff situation?

Conclusion

Your thoughts and comments on this ME-P are appreciated. Feel free to review our top-left column, and top-right sidebar materials, links, URLs and related websites, too. Then, subscribe to the ME-P. It is fast, free and secure.

Link: http://feeds.feedburner.com/HealthcareFinancialsthePostForcxos

Speaker: If you need a moderator or speaker for an upcoming event, Dr. David E. Marcinko; MBA – Publisher-in-Chief of the Medical Executive-Post – is available for seminar or speaking engagements. Contact: MarcinkoAdvisors@msn.com

Our Other Print Books and Related Information Sources:

Health Dictionary Series: http://www.springerpub.com/Search/marcinko

Practice Management: http://www.springerpub.com/product/9780826105752

Physician Financial Planning: http://www.jbpub.com/catalog/0763745790

Medical Risk Management: http://www.jbpub.com/catalog/9780763733421

Hospitals: http://www.crcpress.com/product/isbn/9781439879900

Physician Advisors: www.CertifiedMedicalPlanner.org

Product Details  Product Details

How Bad Is Our National Debt Problem, Anyway?

Join Our Mailing List

And … Will a Deal Fix It?

By Theodoric Meyer
ProPublica, Dec. 28, 2012, 12:34 p.m.

President Obama will meet with congressional leaders today [1] in another attempt to avert the fiscal cliff — the automatic tax increases and spending cuts set to take effect Jan. 1st unless Congress can strike a deal. The cuts and tax hikes, which total more than $500 billion, are so large and so sudden that many economists fear they would plunge the country back into recession.

As Washington tries to hash out a deal, we’ve taken a step back to break down the numbers behind our deficit — how it grew so big, why it is actually shrinking and whether a deal can bring it under control.

How much are we in debt?

The federal debt is just shy of $16.4 trillion [2] at the moment, which also happens to be the debt limit that Congress set in 2011. Treasury Secretary Timothy F. Geithner announced on Wednesday [3] that the nation would hit the limit on Dec. 31. The Treasury can take some “extraordinary measures” to keep paying its bills for a few weeks, but it’ll run out of cash by February or March unless Congress raises the limit again.

And that’s different from the deficit, right?

Yes. The debt is the total amount of the government’s outstanding obligations. The deficit is how much the government is in the red in a given year. In the 2012 fiscal year, which ended Sept. 30, the deficit amounted to $1.1 trillion [4].

That seems like a huge number. How did the deficit get so big?

The 2012 deficit was actually the smallest one since 2008. But it’s still a giant shortfall.

As Binyamin Appelbaum noted in The New York Times [5], the federal government has run a deficit in 45 of the last 50 years. (The exceptions were 1969 and 1998 through 2001.) The financial crisis in 2008, however, caused the deficit to skyrocket, as tax revenues fell because of the slump in incomes and production, and government spending on the stimulus and safety net measures such as unemployment insurance shot up. The deficit for the 2008 fiscal year was $455 billion. In 2009, it surged to more than $1.4 trillion.

Since then, the deficit has been falling, albeit very slowly. The government took in 6.4 percent more in taxes in 2012 than in 2011, as the economy improved a bit and several tax breaks expired. And it spent less on Medicaid, unemployment insurance and the continuing operations in Iraq and Afghanistan.

What about the total debt? How much of that is President Obama’s fault?

The debt has grown by nearly $6 trillion since Obama took office, from $10.5 trillion to $16.4 trillion.

Figuring out how much of that is due to Obama is tougher. The Washington Post’s Ezra Klein, working with the Center on Budget and Policy Priorities, calculated in January [6] that the legislation Obama had actually signed — as opposed to factors like the economy — had added about $983 billion to the debt.

Klein has also rounded up several charts [7] that break down exactly what’s caused our debt to grow so large. The biggest single factor has been the weak economy; President George W. Bush’s tax cuts and the wars in Iraq and Afghanistan also fueled the debt buildup, as did President Obama’s stimulus.

Have debt levels ever been this high before?

Yes, proportionally. Economists like talk about a country’s debt in relation to its gross domestic product (a measure of the economy’s total annual output). And instead of using a country’s total outstanding debt to calculate this debt-to-GDP ratio, economists typically use the amount of debt held by the public. (Somewhat confusingly, the federal government holds about $5 trillion in obligations to itself, most of which is money owed to the funds that support Social Security and other programs.)

Using this measurement, our debt was about 67.7 percent of GDP last year. As this chart compiled by Quartz’s Ritchie King shows [8], that’s the highest our debt-to-GDP ratio has been since the 1940s, when the need to finance World War II caused the debt to surge to 112.7 percent of GDP. But the economy grew fast enough after the war that the debt soon became a much smaller percentage of the country’s GDP.

It’s worth noting that a number of other developed countries have higher debt-to-GDP ratios [9] than the U.S. Germany’s public debt is 80.6 percent of GDP, and Canada’s is 87.4 percent. The euro zone’s most troubled countries fare even worse: Italy’s debt is 120.1 percent of GDP; Greece’s is 165.3 percent.

US Capitol

At least we’re not Greece. How much longer can we keep borrowing?

That’s a tough one. Some commentators — including Paul Krugman, the Nobel-winning economist and columnist for The New York Times — have argued that our current deficits are mostly a product of the sluggish economy. The deficit, Krugman wrote last week [10], “is a side-effect of an economic depression, and the first order of business should be to end that depression — which means, among other things, leaving the deficit alone for now.”

Other economists — including Carmen Reinhart and Kenneth Rogoff, who studied eight centuries’ worth of financial crises for their book “This Time Is Different” — argue that countries with debt-to-GDP ratios above a certain level tend to experience slower economic growth. Reinhart and Rogoff suggest the level is around 90 percent of GDP [11] — which the U.S. is rapidly approaching. A recent Congressional Research Service report [12] concluded that while the debt-to-GDP ratio can’t keep rising forever, “it can rise for a time.” The report continued:

It is hard to predict at what point bond holders would deem it to be unsustainable. A few other advanced economies have debt-to-GDP ratios higher than that of the United States. Some of those countries in Europe have recently seen their financing costs rise to the point that they are unable to finance their deficits solely through private markets. But Japan has the highest debt-to-GDP ratio of any advanced economy, and it has continued to be able to finance its debt at extremely low costs.

How does all this fit into the fiscal cliff?  Would a deal to avert it fix our debt problem?

Actually, going over the fiscal cliff would almost singlehandedly erase the deficit. Tax rates would shoot up, and the fiscal cliff’s indiscriminate budget cuts would slash military and safety-net spending alike.

The problem is that all those tax increases and spending cuts would likely throw the economy back into a recession, causing the deficit to balloon again. “The economy will, I think, go off a cliff,” said Ben Bernanke [13], the Federal Reserve chairman.

(For more detail, see The Washington Post’s exhaustive fiscal cliff explainer [14].)

What the two sides are trying to do is identify cuts that are ultimately deep enough to bring down the deficit — and thus, eventually, the debt — without stalling the economy. But negotiations collapsed last week [15] after John Boehner, the Republican House speaker, tried and failed to pass a “Plan B” alternative to the president’s proposal in the House. Obama is set to meet with congressional leaders today to try to strike a deal to block at least some of the cliff’s impact by Monday night. But its prospects seem dim.

“I have to be very honest,” Sen. Harry Reid, the majority leader, said on Thursday. “I don’t know timewise how it can happen now.”

Assessment

Of course, some analysts have pointed out that people on both the Republican and the Democratic sides may actually want to move the cliff just slightly down the road into the next Congress, which convenes Thursday, Jan. 3. The advantages: Boehner can be safely re-elected as Speaker before he has to do serious twisting of arms of fellow GOP House members to get their votes for any compromise plan. And there will be a few more Democrats in the House and the Senate for the White House to rely on in enlisting the votes it needs to ratify any such deal. The disadvantage: Delay makes the risk of miscalculation greater for either or both sides — and for the public.

Link: http://www.propublica.org/article/how-bad-is-our-debt-problem-anyway-and-will-a-deal-fix-it

Conclusion

Your thoughts and comments on this ME-P are appreciated. Feel free to review our top-left column, and top-right sidebar materials, links, URLs and related websites, too. Then, subscribe to the ME-P. It is fast, free and secure.

Link: http://feeds.feedburner.com/HealthcareFinancialsthePostForcxos

Speaker: If you need a moderator or speaker for an upcoming event, Dr. David E. Marcinko; MBA – Publisher-in-Chief of the Medical Executive-Post – is available for seminar or speaking engagements. Contact: MarcinkoAdvisors@msn.com

OUR OTHER PRINT BOOKS AND RELATED INFORMATION SOURCES:

DICTIONARIES: http://www.springerpub.com/Search/marcinko
PHYSICIANS: www.MedicalBusinessAdvisors.com
PRACTICES: www.BusinessofMedicalPractice.com
HOSPITALS: http://www.crcpress.com/product/isbn/9781466558731
CLINICS: http://www.crcpress.com/product/isbn/9781439879900
BLOG: www.MedicalExecutivePost.com
FINANCE: Financial Planning for Physicians and Advisors
INSURANCE: Risk Management and Insurance Strategies for Physicians and Advisors


Product Details  Product Details

Product Details


Understanding the Domestic Unemployment Numbers

Join Our Mailing List

How Can Unemployment Be Going Down?

By Rick Kahler MS CFP® ChFC CCIM www.KahlerFinancial.com

In an economy that isn’t exactly robust, how can unemployment be going down? The recent drop in the unemployment rate from 8.1% to 7.8% caught almost everyone, including me, by surprise. The GDP grew by only 1.5% in the first quarter, and its growth was under 2% for the last 12 years. To get the economy moving again we will need growth of 3% a year.

It isn’t surprising that many pundits were questioning the timing within minutes after the latest unemployment numbers were announced. After all, unemployment is one of the major issues in the Presidential election. Former General Electric CEO Jack Welch and several Fox News commentators even suggested the administration was cooking the books.

The BLS

I don’t believe the Bureau of Labor Statistics is manipulating unemployment data. The process of computing the data is straightforward and transparent. Two surveys go into projecting the unemployment rate, one covering 400,000 businesses and the other questioning 60,000 households. The surveys ask about the number of full-time and part-time employees, whether the part-time employees really want full-time employment, and whether those without a job have looked for a job within the last month.

Cooked Books?

But that doesn’t mean the books aren’t cooked. They are.

“The way the government derives the unemployment numbers has changed significantly over the last 30 years,” writes John Mauldin, editor of the economic newsletter Thoughts from the Frontline, in the October 8, 2012, issue. “Whatever administration is involved, the new equations for determining unemployment result in a lower unemployment rate than they would have if the 1980’s methodology were still in place.”

The Changes

One of the more bizarre changes in the unemployment rate calculation is that people are not considered unemployed unless they have looked for a job in the last 30 days, even if they currently receive unemployment benefits. Mauldin says there are probably many people who haven’t looked for a job in the last 30 days and that most, if not all, of them would consider themselves unemployed. “If you’re not disabled and you’re receiving unemployment or welfare benefits I think you should be counted as unemployed,” he says. He estimates our actual unemployment rate is well over 12%, which doesn’t take into account the 50% of college graduates who are underemployed.

Don’t Blame Obama

Before you blame the Obama administration for the dumbing down of the unemployment rate, this is the same way the Bush administration calculated unemployment.

It’s the same story with the Consumer Price Index, which the government has continually tweaked to give the illusion of a lower CPI than if the 1980’s formula was used.

ShadowStats.com, run by John Williams, calculates the current unemployment and inflation rates using the formulas from the 1980’s. According to that methodology, Williams calculates the unemployment rate (U-6) is 15% and the CPI is 9%.

Regaining Jobs?

The economy has currently regained about half of the jobs lost in the Great Recession of 2008-2009. According to the Liscio Report, it will take another 40 months to reach the level of employment we had prior to the recession. That is if we don’t have another recession, which is doubtful. If all the tax increases slated for January 1 go into effect, the Congressional Budget Office says GDP will shrink 2.9%, which guarantees a recession.

Assessment

So, what was behind the fall in the unemployment rate this month? According to Mauldin, the entire drop came from an increase in part-time workers. He says, “That such significant numbers of people can only find part-time work is not a sign of a strong and growing economy.”

When we look a little deeper, maybe the latest unemployment numbers aren’t such a surprise after all.

Conclusion

Your thoughts and comments on this ME-P are appreciated. Feel free to review our top-left column, and top-right sidebar materials, links, URLs and related websites, too. Then, subscribe to the ME-P. It is fast, free and secure.

Speaker: If you need a moderator or speaker for an upcoming event, Dr. David E. Marcinko; MBA – Publisher-in-Chief of the Medical Executive-Post – is available for seminar or speaking engagements. Contact: MarcinkoAdvisors@msn.com

OUR OTHER PRINT BOOKS AND RELATED INFORMATION SOURCES:

Product Details  Product Details

Why the Government is Not-Like Medical Professionals

Join Our Mailing List

An Endless Supply of US Dollars

By Rick Kahler MS CFP® ChFC CCIM www.KahlerFinancial.com

Is the United States in danger of bankruptcy? Contrary to what you may read in the media or hear from many politicians, no, it isn’t. The US Treasury will never run out of dollars. Unlike doctors and medical professionals, it’s impossible.

Reasons Why?

The reason is relatively simple. The US government owns a printing press. As long as goods, services, or obligations are priced in US dollars, the supply of dollars to our government to buy those goods and services is unlimited. This is not true of individual physicians, corporations, cities, states, and countries that don’t issue their own currency.

For most people, this is a hard concept to grasp, with good reason. The capacity of our government to create an unconstrained supply of dollars is a relatively new phenomenon.

The Gold Standard

Until 1971, all US currency was theoretically redeemable in gold. This was known as the gold standard. In the early decades of the 20th century, you could actually go to a bank and change your dollars for gold. That ability was terminated in 1933, but the dollar’s value was still tied to gold. This basically meant the only way the US government could create new dollars was by obtaining more gold, the supply of which only increases by the new amount of gold mined.

Nixon

In 1971 we had a paradigm change in monetary policy that many still don’t understand. President Nixon decoupled the dollar from the gold standard [Nixon also wanted to flood the country with MDs, and drive down physician income, by opening up medical school admissions]. It became a fiat currency, which is used as a medium of exchange but has no intrinsic value. Suddenly, the US government was no longer constrained by solvency issues and could never run out of money. It could create as many dollars as it wished ie; inflation].

Constraints

This didn’t mean it had no constraints. The major constraint to an issuer of fiat currency is inflation. However, creating money does not guarantee inflation if the newly created money is not spent. Japan, for example, is still fighting deflation even though they’ve been pumping money into reserves like crazy for 20 years.

What should have caused a massive rethinking and reeducating of the financial sector went relatively unnoticed. Text books, professors, economists, and politicians largely continued to follow many pre-1971 monetary principles that became irrelevant overnight.

Unlike the federal government, US states, cities, and other government entities cannot print money. They have to get it the old-fashioned way—from taxes, fees, or borrowing. It’s entirely possible for these entities to go bankrupt, just like individuals and corporations, if their outflow exceeds their inflow.

Europe

Interestingly, the same is true for member countries of the European Union. When in 1999 they adopted the Euro and gave up their sovereign right to print their own money, they took on the same status as states. Therefore, a country like Greece, which is a user of currency as a member of the European Union, can involuntarily default on its obligations.

This is a significant difference between the United States and Greece. While Greece can (and most likely will) go bankrupt because it doesn’t have an unlimited supply of Euros, the US can’t go bankrupt because it does have an unlimited supply of dollars.

The major threat that sovereign countries face is not running out of money, but devaluing their currency through inflation. A devalued currency is one that loses its purchasing power and often results in a lower standard of living.

Assessment

Just because the US can’t involuntarily default on its obligations doesn’t mean we can keep on over spending and pretend we don’t have any money worries. As a nation, we still need to acknowledge and deal with our serious financial problems. So should our doctors, financial planners and financial advisors.

Conclusion

Your thoughts and comments on this ME-P are appreciated. Feel free to review our top-left column, and top-right sidebar materials, links, URLs and related websites, too. Then, subscribe to the ME-P. It is fast, free and secure.

Link: http://feeds.feedburner.com/HealthcareFinancialsthePostForcxos

Speaker: If you need a moderator or speaker for an upcoming event, Dr. David E. Marcinko; MBA – Publisher-in-Chief of the Medical Executive-Post – is available for seminar or speaking engagements. Contact: MarcinkoAdvisors@msn.com

Our Other Print Books and Related Information Sources:

Health Dictionary Series: http://www.springerpub.com/Search/marcinko

Practice Management: http://www.springerpub.com/product/9780826105752

Physician Financial Planning: http://www.jbpub.com/catalog/0763745790

Medical Risk Management: http://www.jbpub.com/catalog/9780763733421

Hospitals: http://www.crcpress.com/product/isbn/9781439879900

Physician Advisors: www.CertifiedMedicalPlanner.org

Product Details  Product Details

CBO Director Elmendorf on Debt and Taxes

Join Our Mailing List

A CBO Political Review

By Children’s Home Society of Florida Foundation

The nonpartisan Congressional Budget Office (CBO) is responsible for providing Congress with financial estimates for future budget and tax policies. CBO Director Douglas Elmendorf testified before the Budget Committee of the House of Representatives on June 6.

Elmendorf started by noting that the public federal debt for the past 40 years has averaged 38% of the economy. At the end of 2008, the public debt was 40% of gross domestic product (GDP). By the end of 2012, the public debt will be 70% of GDP.

Elmendorf pointed out that there are two major trends that will substantially impact the federal budget. First, there are 78 million baby boomers that will be retiring and receiving benefits from Social Security and Medicare. Second, the cost of healthcare for the past decade has been increasing more rapidly than the general inflation rate. He suggests that this increasing cost for healthcare is going to continue for the foreseeable future.

Elmendorf then offered two scenarios for the future. He called these the “baseline scenario” and the “alternative scenario.”

Baseline Scenario

The baseline scenario assumes that the current law will be applicable. On January 1, 2013, the existing tax cuts will expire. In addition to higher tax rates, many individuals will be subject to alternative minimum tax. Finally, the 3.8% tax under the Affordable Care Act will apply starting in 2013.

With the substantial tax increases under the baseline scenario, federal tax revenue increases to 24% of the economy by the year 2037. Elmendorf noted that this would be the highest level of taxation since World War II. Under this scenario, the increasing tax revenue permits debt to be reduced from the current 70% to 53% of GDP by 2037.

The alternative scenario assumes that Congress will follow the pattern of the past four years. The tax cuts enacted in 2001 and 2003 will be extended. The alternative minimum tax exemptions will be indexed. The $5.12 million applicable exclusion amount for gift and estate taxes will continue (with indexed increases in future years). Medicare payment rates for physicians will continue to increase. This last provision has been called the “Doc Fix” in Washington. Finally, federal budgets will continue with the same general provisions that exist today.

Under the alternative scenario, the increasing deficits lead to public debt of 90% of GDP by 2022. With the rising expenditures for the baby boom generation, the public debt increases to 200% of GDP by 2037.

Elmendorf Opines

Elmendorf noted that many economists believe that this large debt may lead to creation of fewer new jobs. He suggested that it will be necessary to increase revenue and decrease spending substantially from projected levels to avoid a large increase in the national debt. He did not specify how this should be accomplished.

Assessment

Chairman of the Federal Reserve Ben Bernanke also testified before Congress this week. He pointed out that January 1 is a “fiscal cliff” that could have great impact on the nation. Bernanke believes that the scheduled increase in taxes and reduction in spending should be spaced out over time to avoid a dramatic impact in January. However, he also declined to offer any advice on specific ways to increase taxes or cut spending.

Editor’s Note: These discussions in Congress are preparations for the legislative session that will occur following the November election. Congress is debating the combination of tax increases and budget cuts to pass this year. In addition, preparations are being made for a major tax reform act in 2013.

Conclusion

Your thoughts and comments on this ME-P are appreciated. Feel free to review our top-left column, and top-right sidebar materials, links, URLs and related websites, too. Then, subscribe to the ME-P. It is fast, free and secure.

Link: http://feeds.feedburner.com/HealthcareFinancialsthePostForcxos

Speaker: If you need a moderator or speaker for an upcoming event, Dr. David E. Marcinko; MBA – Publisher-in-Chief of the Medical Executive-Post – is available for seminar or speaking engagements. Contact: MarcinkoAdvisors@msn.com

Our Other Print Books and Related Information Sources:

Health Dictionary Series: http://www.springerpub.com/Search/marcinko

Practice Management: http://www.springerpub.com/product/9780826105752

Physician Financial Planning: http://www.jbpub.com/catalog/0763745790

Medical Risk Management: http://www.jbpub.com/catalog/9780763733421

Hospitals: http://www.crcpress.com/product/isbn/9781439879900

Physician Advisors: www.CertifiedMedicalPlanner.org

Product DetailsProduct DetailsProduct Details

Product Details  Product Details

Product Details

Understanding the Money Supply as a Percentage of GDP

Join Our Mailing List

By Country for our Domestic and International ME-P Readers

By Staff Reporters

There’s a lot of money in the world, but not all of it can be easily defined as “money.” Just where the money is and who has it is a complicated issue. The wad of money in your pocket is one form of money, but the money supply is hardly limited to that. So, where is the money and what exactly is it?

Finding Out

To find out what Broad Money, Money Zero Maturity, the Monetary Base, and Money and Close Substitutes mean, take a look at the graphic for an explanation. You’ll see that there is a lot more to money than you may have realized. The cash you use from day to day is M0, but there are also MB, M1, M2, M3 and more.

What Is Quasi Money?

If you want to measure how much money a country has, there is much more to consider than just how much printed money is within that country. If you think about how much money you have, it’s likely a lot more than just the cash you have on hand. You have bank accounts, checks and other forms of money that factor into how much money you have. The same is true for countries.

By Country

How much money a country can get pretty complicated, but there is a way to figure out each country’s quasi money. No, this doesn’t mean fake money or “sort of” money, like the name may imply. Quasi money may also sound like our paychecks these days, but what it refers to is actually a pretty neat assessment of the money that a country really has.

The money supply of every single country can be measured accurately by looking at a number of different things. To find out exactly what goes into the money that a country has, take a look at the graphic.

How Does Your Country Stack Up?

How does your country compare to other countries in terms of money? The amount of quasi money in each country when measured as a percentage of a country’s Gross Domestic Product (GDP) is pretty telling. Check out the graphic to see how your country rates and whether it makes the top 10, the bottom 10 or falls somewhere in the middle. If you know someone from a country on the top or bottom lists, forward the graphic to them and let them know about it. Depending on where their country falls, it may be time to gloat or to pretend not to be jealous.

Where are the top and bottom countries located?

Are they countries that are typically thought of as being rich and poor, or do they come straight out of left field for a sneak attack? There are certainly some countries in there that will surprise you as well as some that won’t. Take a look for yourself and see where the wealth of the world lies.

Conclusion

Your thoughts and comments on this ME-P are appreciated. Feel free to review our top-left column, and top-right sidebar materials, links, URLs and related websites, too. Then, subscribe to the ME-P. It is fast, free and secure.

Link: http://feeds.feedburner.com/HealthcareFinancialsthePostForcxos

Speaker: If you need a moderator or speaker for an upcoming event, Dr. David E. Marcinko; MBA – Publisher-in-Chief of the Medical Executive-Post – is available for seminar or speaking engagements. Contact: MarcinkoAdvisors@msn.com

Our Other Print Books and Related Information Sources:

Health Dictionary Series: http://www.springerpub.com/Search/marcinko

Practice Management: http://www.springerpub.com/product/9780826105752

Physician Financial Planning: http://www.jbpub.com/catalog/0763745790

Medical Risk Management: http://www.jbpub.com/catalog/9780763733421

Hospitals: http://www.crcpress.com/product/isbn/9781439879900

Physician Advisors: www.CertifiedMedicalPlanner.org

Product Details  Product Details

What is the Cost of eHRs?

Join Our Mailing List

A Retrospective Look-Back

By Richard J. Mata; MD CIS CMP™

Studies by the Organization for Economic Cooperation and Development (OECD) show that healthcare spending in the U.S. accounts for 16-17% of GDP, which is more than six-seven percentage points higher than the average of 8.9% in other OECD countries.  This translates into per capita health spending of $5,635 in the U.S. compared with median costs of $2,280 in other OECD countries.[1]  Suggestions as to the economic drivers of U.S. health spending include excessive service use, administrative complexity, population aging, threats of malpractice litigation, defensive medicine practices, and the lack of patient waiting lists.  In further comparisons with the OECD countries, it appears the U.S. overpays for physician visits, hospital stays, and pharmaceuticals.

In the Year 2004

A 2004 OECD paper suggested that one way of improving performance would be to move towards EHR:

Health systems should invest in automated health-data systems, including electronic medical records and systems to automate medication orders in hospitals. Better systems for recording and tracking data on patients, health and health care are needed to make major improvements in the quality of care.[2]

In the U.S., possible savings from the adoption of EHR have been projected to reach $142 billion in physician office visits, and $371 billion in hospital costs over a 15-year period.  These projections have not been validated by the experience in other OECD countries where the adoption movement is ahead of U.S. efforts by anything from four to thirteen years.

Nevertheless, the U.S. began its quest to move towards EHR in 2004 as medical software companies began actively marketing their systems, although funding for this endeavor did not come through until 2006.  In spite of this effort, the U.S. has the lowest percentage of physician providers using any EHR compared to Germany, Canada, United Kingdom, and Australia.  The U. S. physicians’ low adoption rate involves fear of the loss of productivity, lack of financial incentives, and high startup costs of as high as $40,000 per physician EHR adoption.

When spending on IT implementation in the healthcare system is compared on an international level, the U.S. lags dramatically behind the major OECD countries.  The U.S. spends $0.43 per capita compared to a high of $193 in the U.K.  This difference is even more dramatic when compared with the German experience, where IT adoption in the healthcare system is almost universal.  In thirteen years, Germany has spent $1.88 billion.  Their annual per capita cost has been $1.63.  The U.S. has reached only 25% of that expenditure so far.

Barriers to Adoption

The greatest barrier to adoption of EHR in most OECD countries has been the need to simplify the health insurance contracts payment structures with standard nomenclatures that can be adapted to EHR.  The major OECD countries also report that there must be a national adoption of IT standards in the healthcare system as well as a national effort to focus on privacy and confidentiality standards.  This assures better coordination of implementation and provides better strategies for adoptions through public incentives and grants.


Domestic 5 Year Costs

In the U.S., the five-year costs for a national IT healthcare network have been estimated to be as high as $103 billion in capital and $53 billion in interoperability.  Hospital costs for functionality were estimated to be $51 billion, skilled nursing facilities would bear $31 billion of costs, and physician offices would bear $18 billion of the costs. (Anderson, 2006)  EHR systems that have been implemented have been used mainly for administrative rather than clinical purposes.

In the Year 2005

A 2005 study by Richard Hillestad and colleagues at RAND[3] estimates that implementation of a nationwide EHR network would take about 15 years and cost hospitals about $98 billion and physicians about $17 billion.  Over the 15-year period, the average annual cost to hospitals would be $6.5 billion and the average annual cost to physicians would be $1.1 billion (CQ HealthBeat [1], 9/14). However, if 90% of providers adopted such a network, annual savings would total $81 billion, including $77 billion from improved efficiency and $4 billion from reduced medical errors, the RAND study found.  The study estimates that an EHR network would reduce adverse drug events in inpatient hospital settings by 200,000 annually and reduce such events in ambulatory settings by two million annually, saving $1 billion annually in hospitals and $3.5 billion in ambulatory settings.  For hospitals, about 60% of these savings would be from reduced adverse drug events in patients ages 65 and older, while 40% of savings to ambulatory practices from reduced medication errors would be in patients 65 and older (CQ HealthBeat [1], 9/14).

Assessment

In addition, the study estimates that a national EHR network would save Medicare about $23 billion annually and save private insurers about $31 billion annually.  The study projects that the estimated total annual savings of $81 billion would double if providers followed all checkup reminders and other prompts from the system (AP/Las Vegas Sun, 9/14).  Currently, about 20% to 25% of hospitals and 15% to 20% of physician offices have EHR systems, according to the study (CQ HealthBeat [1], 9/14).

But, what is the estimated cost in 2010?

Join Our Mailing List 

Conclusion

Your thoughts and comments on this ME-P are appreciated. Feel free to review our top-left column, and top-right sidebar materials, links, URLs and related websites, too. Then, subscribe to the ME-P. It is fast, free and secure.

Link: http://feeds.feedburner.com/HealthcareFinancialsthePostForcxos

Speaker: If you need a moderator or speaker for an upcoming event, Dr. David E. Marcinko; MBA – Publisher-in-Chief of the Medical Executive-Post – is available for seminar or speaking engagements. Contact: MarcinkoAdvisors@msn.com

OUR OTHER PRINT BOOKS AND RELATED INFORMATION SOURCES:

DICTIONARIES: http://www.springerpub.com/Search/marcinko
PHYSICIANS: www.MedicalBusinessAdvisors.com
PRACTICES: www.BusinessofMedicalPractice.com
HOSPITALS: http://www.crcpress.com/product/isbn/9781466558731
CLINICS: http://www.crcpress.com/product/isbn/9781439879900
BLOG: www.MedicalExecutivePost.com
FINANCE: Financial Planning for Physicians and Advisors
INSURANCE: Risk Management and Insurance Strategies for Physicians and Advisors

References:


[1]    For details of the report, see http://www.oecd.org/dataoecd/29/52/36960035.pdf.

[2]   OECD, Towards High-Performing Health Systems, see http://www.oecd.org/document/26/0,2340,en_2649_37407_31734042_1_1_1_37407,00.htm.

[3]   See http://www.rand.org/health/feature/2006/060414_shekelle.html.  The report is also discussed in some detail in Neergaard, AP/Las Vegas Sun, 9/14/05.  See http://www.ihealthbeat.org/index.cfm?Action=dspItem&itemID=114707.

Product DetailsProduct Details

Product Details

Of Wants, Needs, Economic Sustainability and Even Healthcare Reform

A Social Domestic Healthcare Initiative?

By Somnath Basu PhD, MBA [www.clunet.edu/cif]

[Director California Institute of Finance]

Necessities, conveniences and luxuries are an articulation of the hierarchy within wants and needs. The scale and scope of this hierarchy seems quite seamless at the surface. Food, micro waved dinners to gourmet meals. Transportation needs become personal transportation needs and then into Ferraris. Family picnics are replaced by TVs and then by exotic vacations. Home rentals needs change to the wanting of mansions.

As we move up each of the needs totem poles, our monetary requirements stretch endlessly; otherwise if we were all able to bask in everlasting luxury, the end of capitalism and free markets would be in sight. The ideal of everlasting luxury forever too is therefore necessarily unachievable but something that is pursuable, forever. In this vein of reasoning, all of society’s resources and endeavors must go towards attaining this ideal. What then are the limitations of such pursuits?

The above concept of needs and wants also defines layers of society by their consumption abilities. It also defines the pressures imposed upon the growth of GDP from large sections of society to increase their consumption. It is a single-minded pursuit by the upper middle-class of society to strive towards the entering the class of the wealthy, followed by the middle class seeking upper-middle class status, etc. The wealthy comprise a group who are small in number (10% or less) but who account for more than 67% of the ownership and consumption of resources and production, respectively. As large numbers of people start striving to break into the next higher classes of citizenry, pressures increase for GDP to grow. Over time, the wealthy get wealthier, some new entrants appear in each socio-economic group while the general population at large become poorer and more frustrated from this sum-zero game. At some point, the sustainability of the economic system is tested and then broken; societies develop, peak and then wither through strife.

GDP Pressures

For the event of the entire upper-middle class citizenry of joining the class of the wealthy to happen, the GDP would probably need to grow at about a rate of 10 – 12% per year, for each of the next 10 to 20 years! We can easily deduce that for the remaining 80% of the population, the ideal is mostly unachievable. Thus, it may be useful to ask ourselves what is a desirable benchmark for our way of life? “How much money do we need to be happy?” may be another variable approach. Clearly, there are social costs arising from our relentless pursuits of wealth.

To properly assess the cost-benefits of our economic system we need to explore two issues at the heart of the situation. One is the production of wealth. The second is its distribution. Clearly, distributing some wealth inequally is preferred to distributing nothing equally. The question then becomes one of society’s tolerances of inequality. Thought another way, how is enough provided at each level of society such that there is strive and not strife, such that the entire society is better off.

The Elderly

One victim to the current economic system is the elderly. In relentlessly pursuing growth and consumption of luxuries over anything else, we often forget to save for the years where we are no more productive, in a GDP sense.  The retirement woes of the generation of unprepared baby boomers can be seen in articles and papers in many depressing data forms. The main reason we fall victim to being unprepared for retirement is the need to spend every penny we earn on consumption so as not to forget that we are striving to attain the ranks of the upper echelons of society and which demands that our consumption and lifestyles mimic those we aspire to emulate. Using this example, we can take a closer look at some of our spending patterns and understand the pressures we impose upon our savings, GDP growth and the limitations inherent in such growth.


What is Enough?

We spend about 17% on transportation, another 15% on food, and about 35% on housing. This is the national average. If collectively we wished to move into the class of the wealthy, we would impose immense pressure on GDP, one that would clearly not be sustainable. That begs the question as to what’s enough. There is somewhere along these lines of reasoning a place of social well being, where the pressures of producing wealth do not dominate our lifestyles.

Global Considerations

On another plane an argument can be made for the prolongation of our imperial life cycle. As with any cycle, micro or macro, our rein at the top of the global economic cycle is waning; the question then becomes as to what course of action can slow down our descent. It is the respite we need where we can also plan for our grandchildren and beyond, rather than be engrossed in current mindless consumption and the bequest of their repercussions for generations to come. Slowing down consumption is one way of prolonging our place near the top; our “apparent” successor, China, depends mostly on us to buy the goods that they produce on our behalf. Developing fully China’s own middle markets for consumption and reducing its dependency on our consumption will take more than one lifetime for the Chinese. On the same note, let us not give away our technological supremacy to India either. In pursuit of the bottom line and exporting many technical and business jobs to India in the name of bottom line economics will also eventually impoverish our own citizens.

American Economics Nobel laureates

A recent study conducted by two American Economics Nobel laureates (Joseph Stiglitz and Amartya Kumar Sen) examined the very issue of GDP focus on behalf of the Government of France. Their findings were of a similar vein where they questioned the government’s fixation with GDP and society’s need for a balanced, sustainable and comfortable lifestyle. They found that using only GDP as the benchmark lead to myopia of sorts amongst government officials that people are happy and satisfied or that their relentless pursuit of GDP growth does not matter to them. The scientists also found that a need exists among people to also have an achievable benchmark of happiness and satisfaction with life without the mires of just GDP alone.

In a sense, if people can be liberated from the necessary requirements of basic living (food, shelter, basic healthcare and retirement), the self-induced pressures to outperform economically, along with the accompanying social malaises, would not be necessary; our lifestyles would also possibly change in very meaningful and simplifying ways as we seek more sustainable allocations of our land, labor and capital.

While the idea above may sound utopian at first, it may be useful to note that there are some societies in the world (primarily Scandinavia) where a much smaller version of such a system exists. First, a visit to any of those countries will persuade any American that their style of life is no less than ours. This is in spite of lesser wages and a staggering (income and sales) tax burden. However, ironically, it is the latter reason (high tax rate) that allows the citizens in Scandinavia to enjoy free education (up to any academic level and including boarding, lodging and international studies!), adequate and free healthcare, subsidized and efficient transportation and a basic pension for all upon retirement. However, this magic is mainly because of a small and highly efficient government giving back probably 90 cents for every dollar worth of taxes collected. Now, that is public good.

Join Our Mailing List

The First Issue

What are the issues for us to scale to such a system? Obviously, the first is not having such a big and unwieldy government. Unfortunately, a lean, mean and highly efficient government is not foreseeable for us either in the near future and neither are higher tax rates. Higher tax rates just drives high income individuals and businesses underground and is not a market solution. Can our society at large demanding such a welfare state, be willing participants in such a system and demand such a government? If it did, we certainly could sail smoother through our busy impersonal lives. Having the GDP monkey off our backs will certainly calm us; consider the intense polarization in political thought around the globe arising from inequities of both consumption and thought. A sustainable solution that creates a safety net for all citizens would indeed be desirable for any society.

The Second Issue

This brings back the second issue, the issue of wealth distribution among society. Even when a non-market system (such as taxes) does not work in making society more egalitarian, a reallocation of wealth is somewhat desirable but no tools exist to make this happen. Possibly, the only market solution is philanthropy where suppliers provide capital for fulfilling social needs.

In the true sense of a long run, the ethical decision of philanthropy is also utilitarian; the value of the family name pays back handsomely to the family over the years. It is well known that where moderately large inheritances are left purely to the children and family inheritors, the family descends into decadence and the wealth is squandered in about three generations.

Of Relentless Pursuits

In a society where economic demarcation lines cannot be drawn but exist, the population at large will go towards a state of constant strife for higher status and eventually self-destruct. In other words, a mass population fed on this idea of relentless pursuit of income or wealth will eventually not be able to sustain itself and disintegrate and decay in its social fabric. In the long run, keeping people distracted by wars, economic woes or other narrow global or domestic events will not keep people placated forever; people have a way of collectively being heard.

Our Global Role

While the above may seem like a commentary on our own social system, it is not. The recent financial disasters have taught us that going into the future, no solution can remain purely domestic in nature. This world, through the unifying effect of the financial disaster, has learnt like never before, that any sustainable solution has to be global in nature. Now, more than at any time before, we must shed any feeling of ethnocentrism and nationalism and prepare to enter and lead the world through global solutions. After all, in relation to the about 5.5 other billion people, our way of life is still grand and we remain the Mecca of all aspiring global citizens.

Politics

As a political nation, we have shown that we are more enlightened than any other nation when we elected the Mr. Barack H. Obama as the President of the country. Ask this simple question: which Caucasian majority country will next vote a non-Caucasian to its highest seat? Nowhere, not in our lifetimes, I think.

Yet by electing President Obama, we sent a clear signal to the rest of the world about our system of meritocracy which very few societies can show and also not brag about.  Through this action we have also shown that we have the political will and dedication to bring around changes in shape to global economic systems as well.

A social domestic healthcare initiative, even if it be a non-market solution, is one in the right vein, though only time will tell if we executed the policy correctly or not.


Editor’s Note: Somnath Basu PhD is program director of the California Institute of Finance in the School of Business at California Lutheran University where he’s also a professor of finance. He can be reached at (805) 493 3980 or basu@callutheran.edu. See the agebander at work at www.agebander.com

Assessment

As for myself, I would be willing to pay the costs for a social safety net. If I was assured of some basic amenities by way of food, lodging, healthcare and retirement, I would be quite willing to do the requisite work to pay the appropriate cost and spend the rest of my time in a warm sunny beach and eventually experience the liberating feeling of retirement and enjoy each day as the holiday it is.

Conclusion

Your thoughts and comments on this ME-P are appreciated. Feel free to review our top-left column, and top-right sidebar materials, links, URLs and related websites, too. Then, subscribe to the ME-P. It is fast, free and secure.

Speaker: If you need a moderator or speaker for an upcoming event, Dr. David E. Marcinko; MBA – Publisher-in-Chief of the Medical Executive-Post – is available for seminar or speaking engagements. Contact: MarcinkoAdvisors@msn.com

OUR OTHER PRINT BOOKS AND RELATED INFORMATION SOURCES:

Comprehensive Financial Planning Strategies for Doctors and Advisors: Best Practices from Leading Consultants and Certified Medical Planners™

***

Predicting the Economic Recovery

Join Our Mailing List

How Would Life Change – Even if Prescience Possible?

By Somnath Basu PhD, MBA [www.clunet.edu/cif]

All medical professionals and ME-P readers should know that there’s about a 50% chance that someone will predict correctly when and how the domestic economy will recover. The chances of that person failing are the same, at 50%. There is very little chance (probability approaching zero) that nothing will change. Under these circumstances, it’s quite easy for the pundits to take a shot at being right. It is easy to be wrong because it’ll never be held against them, given the circumstances around the global financial crisis. There’s always a way out of being wrong.

Of Rumors, Guesses, Optimism and Pessimism

Of course being right has its rewards of reaping benefits without any downside. In the meantime, a whole nation is being held hostage as to what happens next. Rumors, guesses, optimism, pessimism abound as stock markets rise and fall, employment goes down by less or more than expected, price of oil suddenly becomes a leading economic indicator, China starts showing the way out, interest rates remain low, home (new, used, new construction, commercial vs. residential) sales increase and decrease in tandem, inflation is a problem but not deflation or vice versa and the economy grows as expected or not. The bewilderment at this state of things is taking a toll but the pundits keep going on. Politicians scream and bureaucrats moan. Obviously, this too is a crisis of sorts.

The Two Questions

There are two questions that fall out of this scenario. First, how does one predict the economy and how sound are the methodologies. Second, and more importantly, do we really need a prediction? I will explore these questions in the order presented above but the first one in more detail.

Let’s Begin the Evaluation

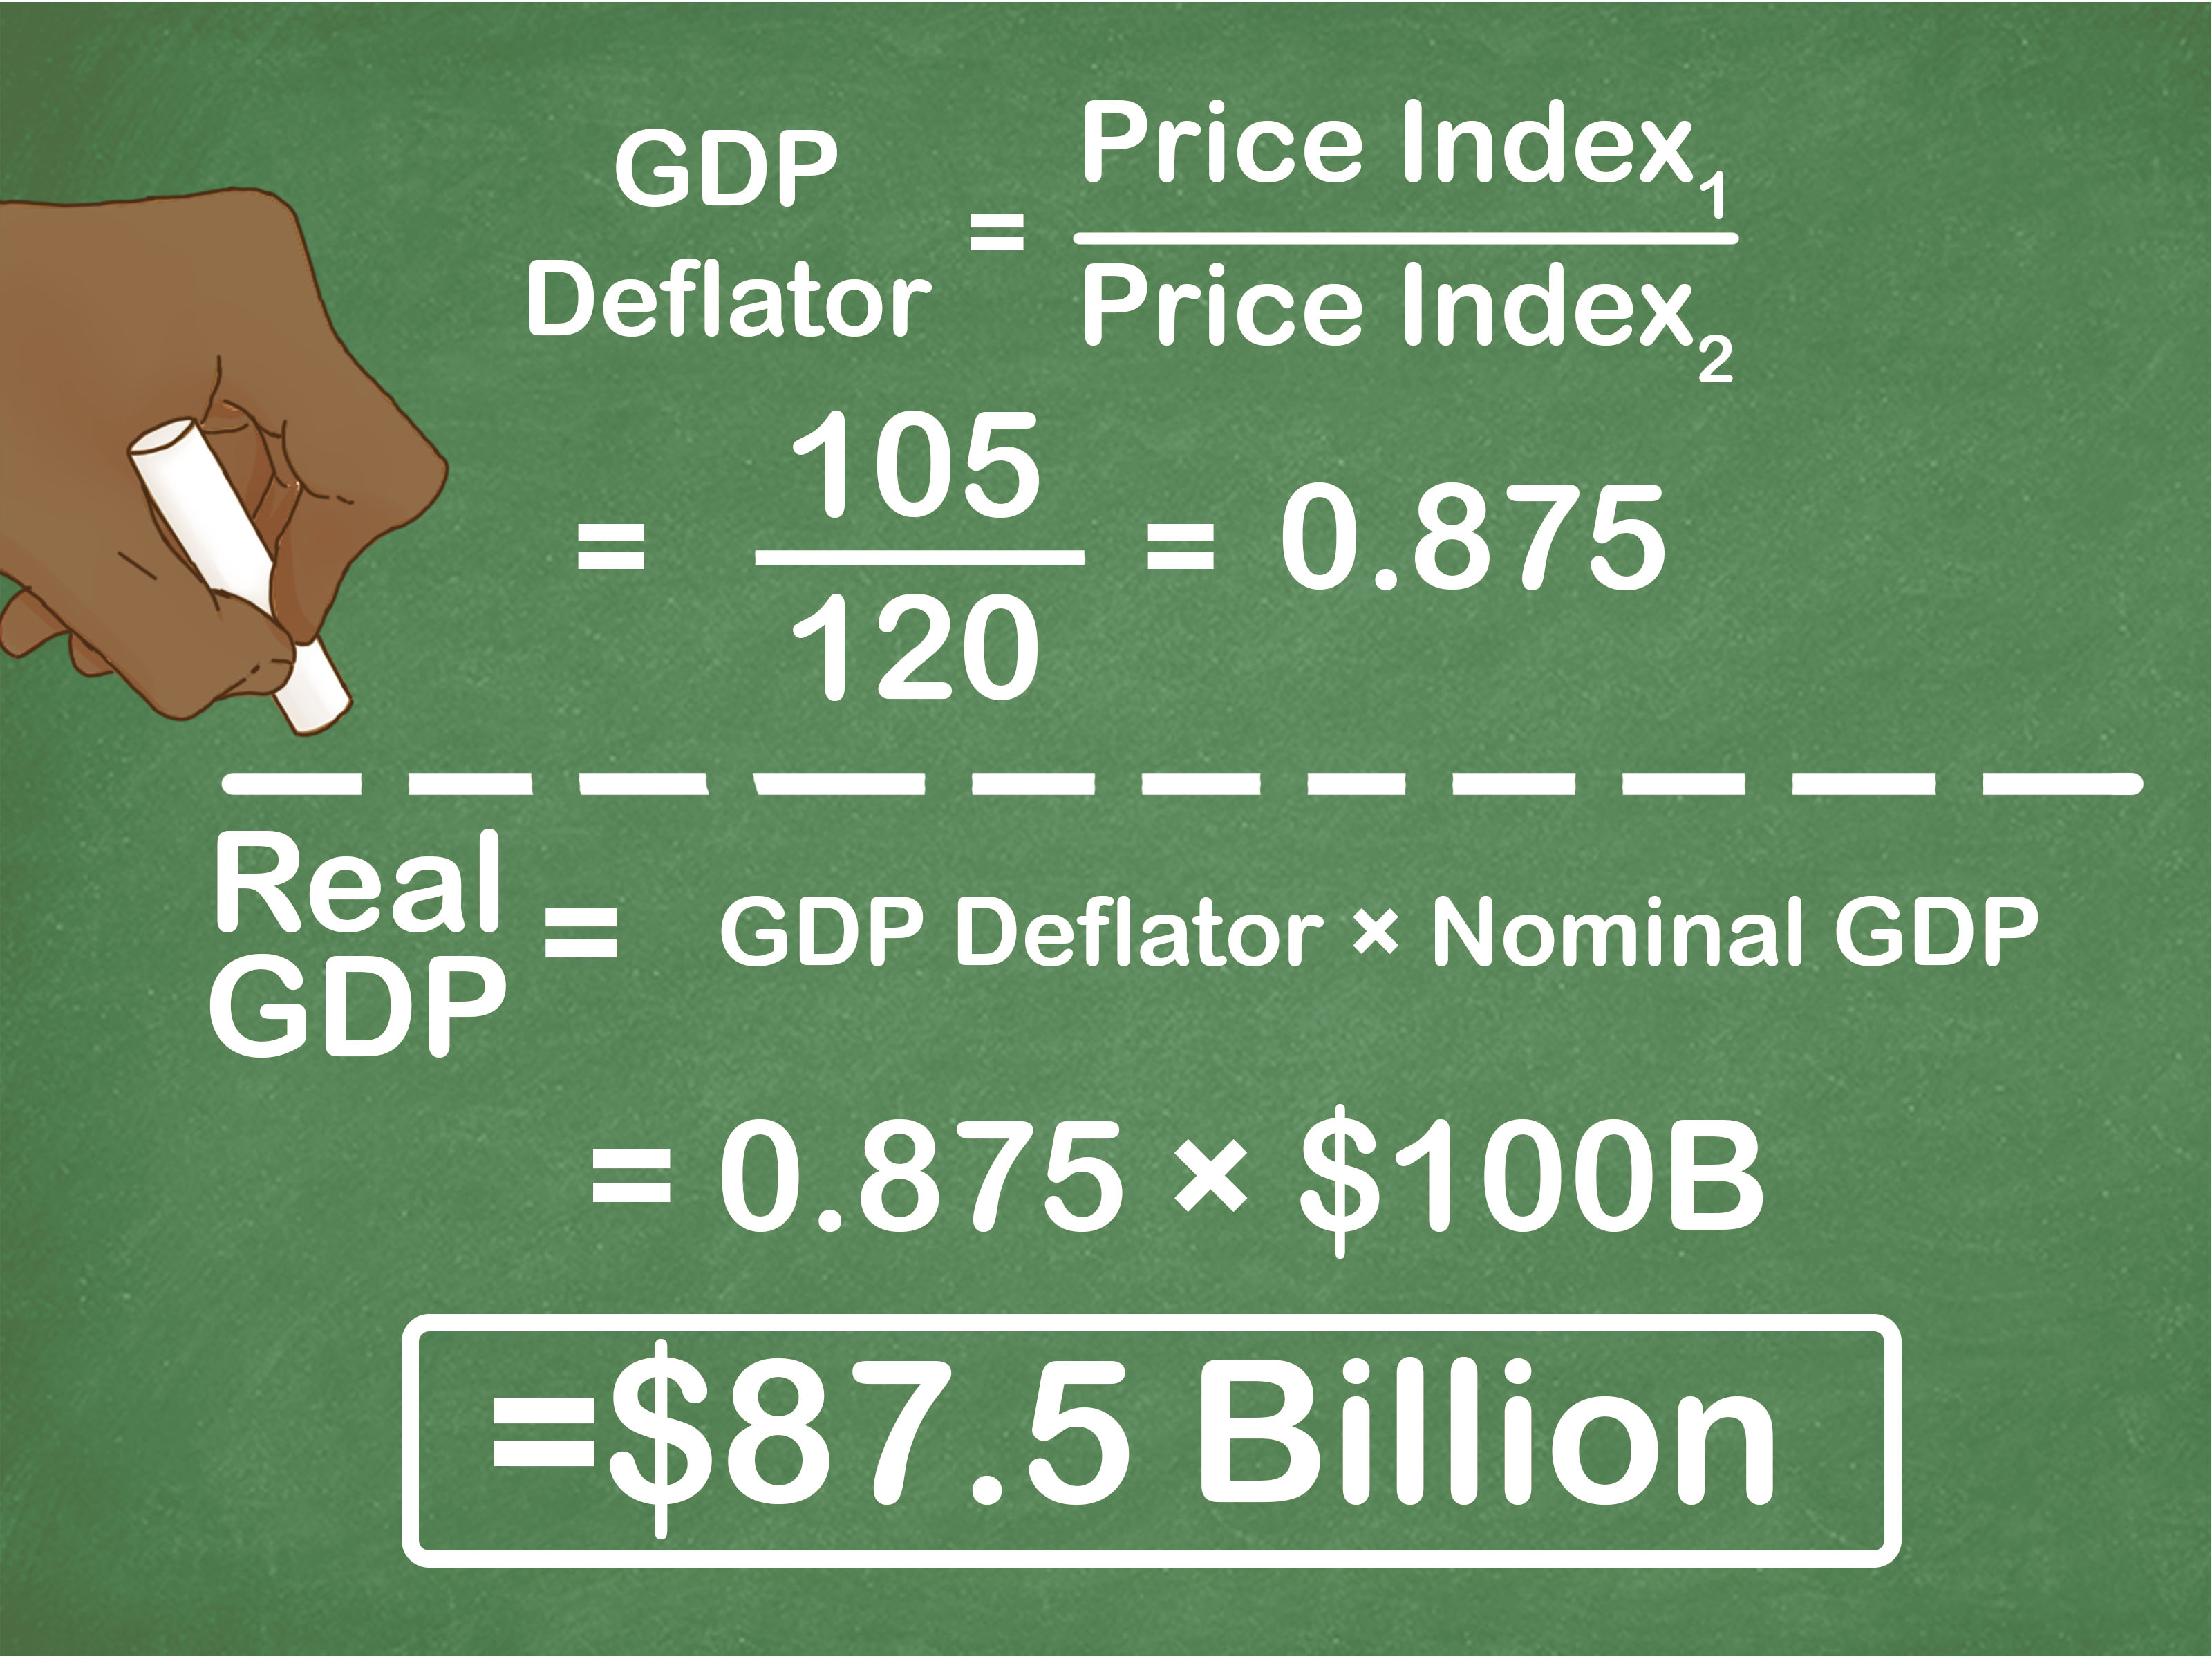
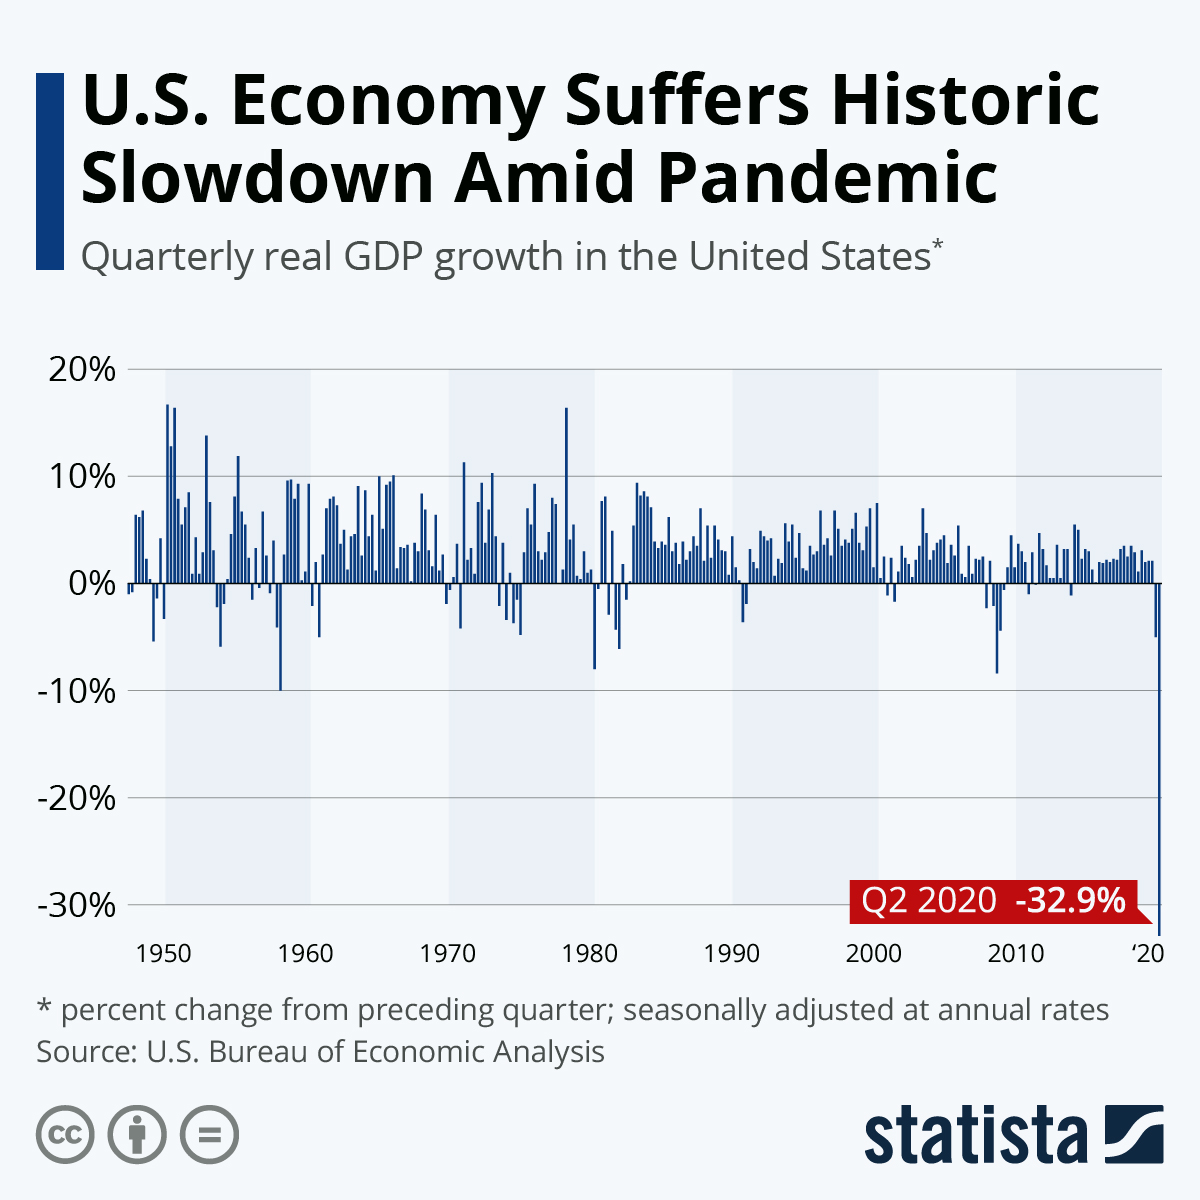
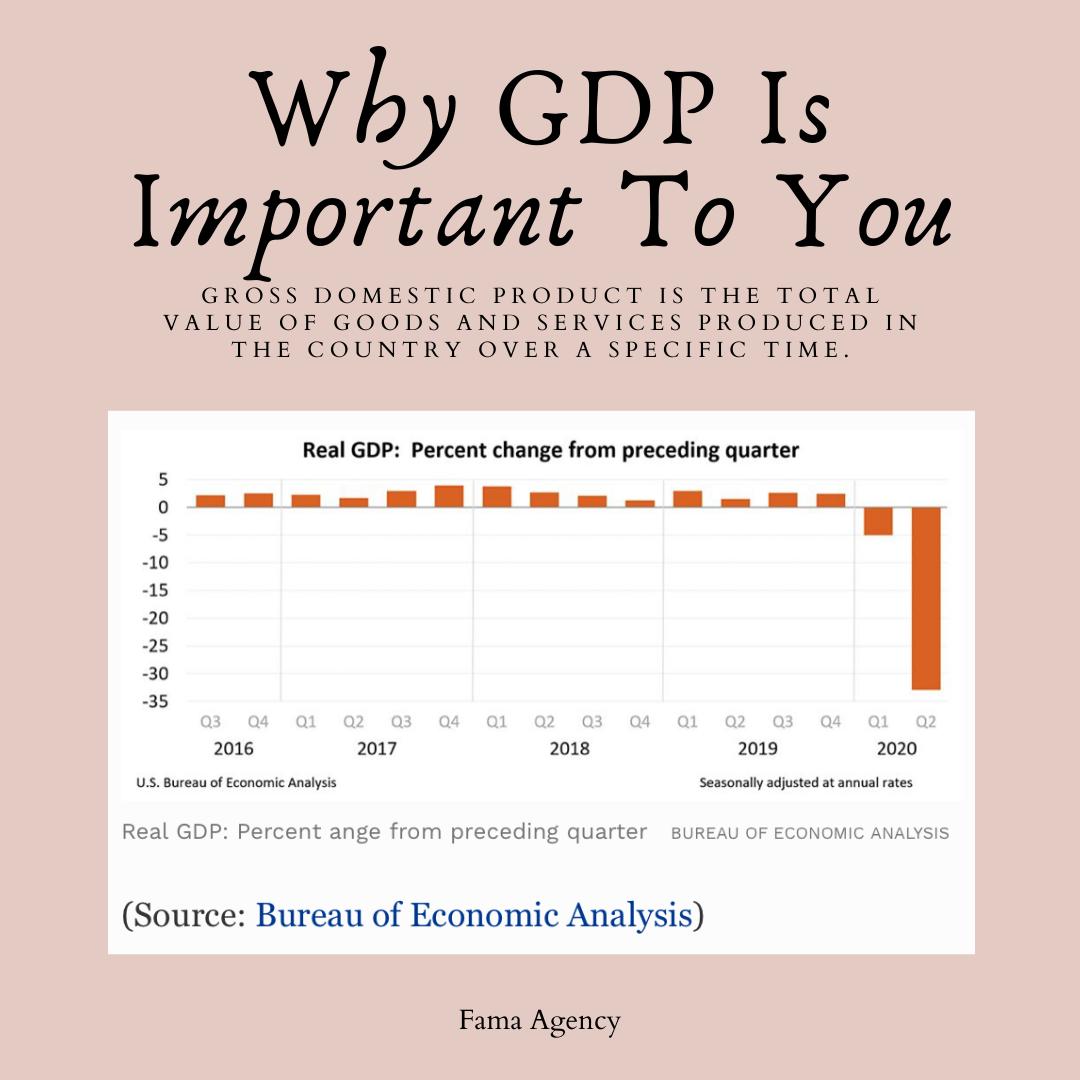
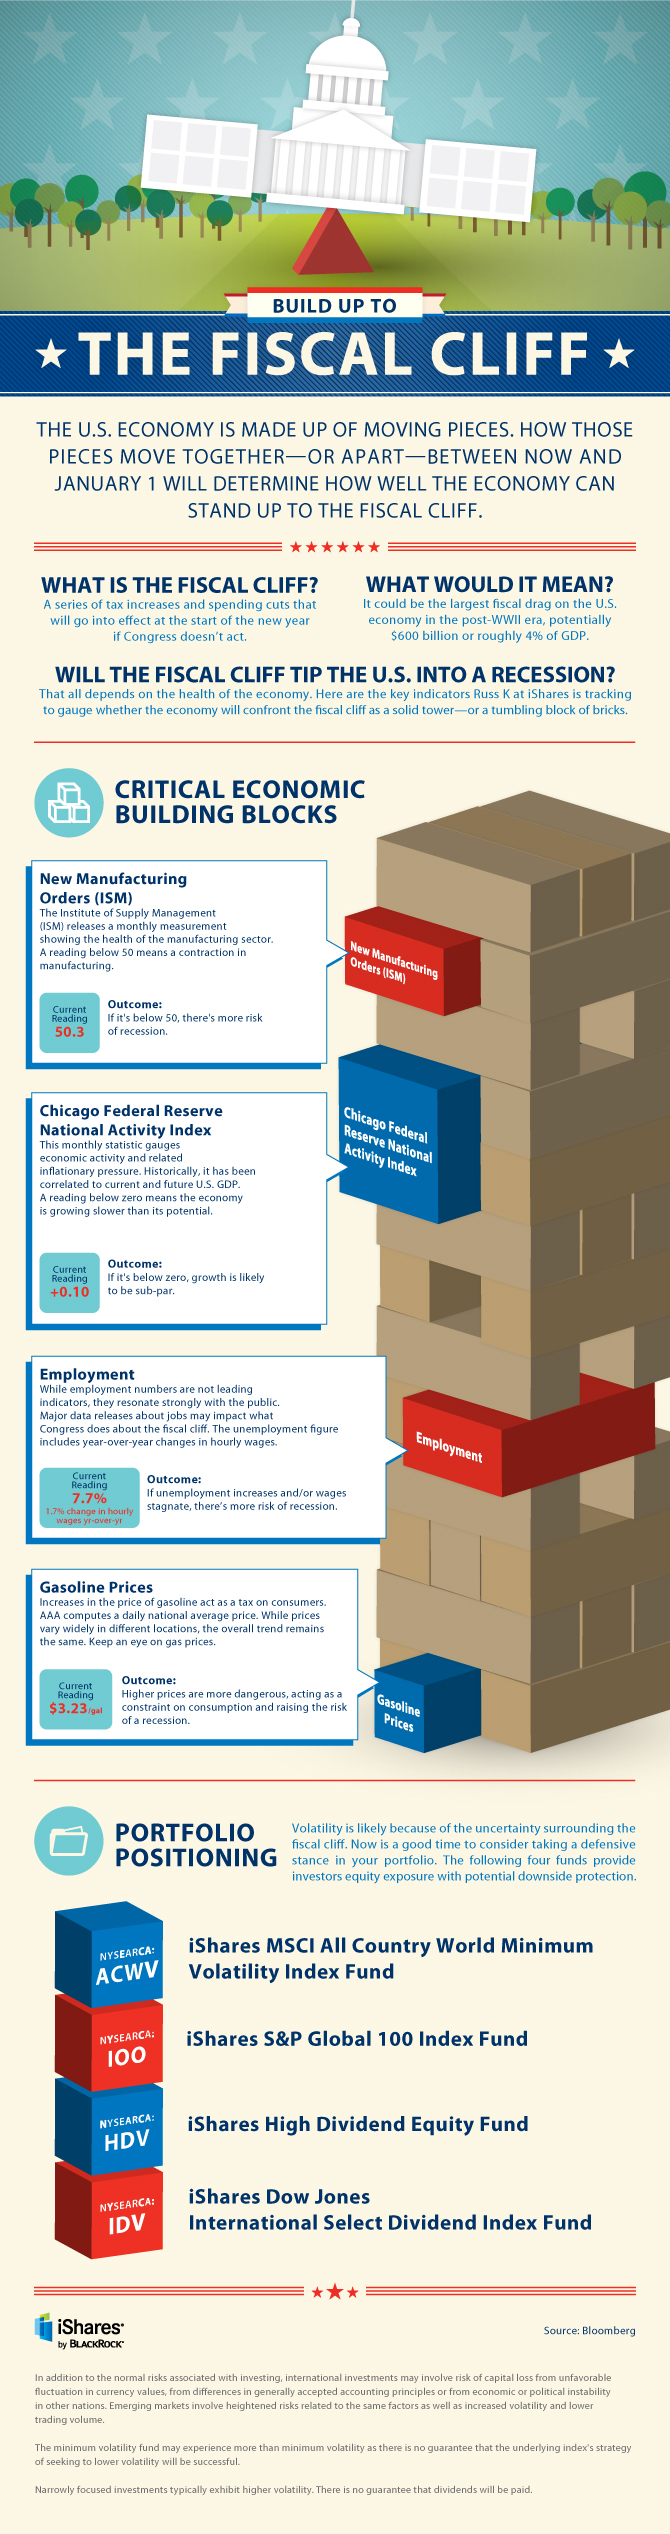
To begin with, it’s useful to evaluate the techniques used by our economic gurus who preach lofty sermons from their altars. These folks have a battalion of charts and graphs depicting why something is happening, ably backed up by rigorous mathematical models that have passed the test of their enlightened peers. These people consider economic indicators using complex models of GDP growth, change in unemployment, trade imbalances, flow of goods and services etc. etc. At the end of the day, they still have a 50% chance of being right. Of course they have a theory already explain this possibility (efficient market hypothesis, or EMH) which they use to explain why the market cannot be predicted with any certainty and the odds of predicting correctly are as good as repeatedly calling a coin toss right. However, it seems that this does not dampen their need in any way to keep on predicting.


 The Comparisons

Compared to previous recessions, there is a marked difference with the one we just experienced. This difference is that the great recession of 2008-09 can be considered as the first true global recession where even remote countries in Africa experienced mild recessionary conditions.

Hence, one of the first requirements for the predicting community is to truly incorporate global economic conditions in predicting the future. The current emphasis on domestic economic conditions precludes to an extent our ability to comprehend the changes underlying this “one world” which is necessary to get closer to a more realistic prediction. Further, we should include not only the developed economies along with some of the major emerging markets, but literally all economies, in extending our analysis. As we will ponder later, our model for prediction should be much more inclusive of all countries, no matter how small or economically less developed the countries are.  The understanding here is that given the fragile nature of the global economy at present, even a small non-economic ripple in a distant land can turn into something that encompasses the globe in some kind of economic turmoil.

Thus, hopefully, a globally inclusive model of understanding should definitely help us in the business of prediction.

Departure from the Traditional View

At this point I am going to depart from the traditional view that predicting the future of any economy should necessarily be an exclusive economic model. I shall argue that in this world we live in, such a model is inadequate if we realistically expect to beat the odds of a coin toss game. The point I seek to make is that in a world where we are so dependent of each other, how can we exclude factors like political or social conditions, geographic dispositions and historical interrelations, religion, world health, poverty or global climate change. I am going to elaborate upon some of these above contentions with some simple examples to support my view of an all inclusive understanding model before we go about the business of predicting the economy.

War- What is it Good For?

Consider the politics of wars in the world. Does it have an impact on our economy? It sure does. If we are directly involved, it has a huge cost in human suffering besides the direct dollar cost of war. The countries we are engaged in are similarly impacted by their casualties in human lives (and the subsequent economic effect of that) and the real time dollar costs of the real and financial economy being in shambles. If our country is not directly involved in some war overseas, then the whole defense and allied industries stands to gain – we are by far the largest suppliers of weapons in the world. Hence any war has economic consequences from tangible dollar costs to the associated costs of low morale, drops in consumer confidence, etc. An even simpler example would be to look at the wars we are engaged in (in Iraq and Afghanistan) and ask ourselves whether the economic consequences are not sufficient enough to be included in a predictive model.

Global Climate Change

What about global climate change? It is far too late to say it is not real. The main question is whether the economic consequences of global climate change are large enough to be included in any predictive model. What is the impact of climate change on our economy from the increased ravages of floods,   and famines? Costs in crop loss, insurance claims, higher food prices etc. etc. are surely not trivial. Are we willing to say that in the future these extremes of weather will dissipate and not increase so that we do not need to consider their economic impacts? If the climate changes problem is real then we do need to do something about carbon emissions and fossil fuels even as we find larger and larger oil deposits.

However, it is not enough for us to move strongly in this direction. China and India are already crying foul as the world tries to persuade these two countries to slow down carbon emissions. It is a difficult pitch to sell since the retort is that the economic development in the western world is what caused this condition and it is unfair to ask these two countries to slow down their growth ambitions especially since they have waited so long to wait their turn.

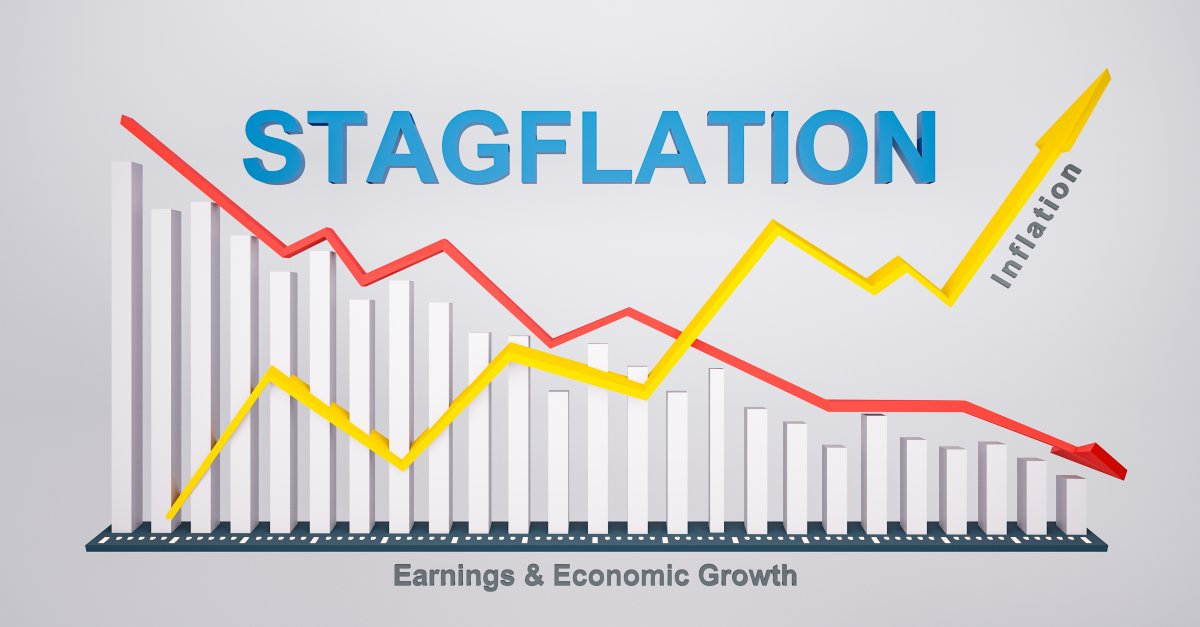
Moreover, less consumption of commodities (e.g. of oil, steel, building material) by China and India will trigger economic events of their own since lower production levels in these countries would mean higher costs to us since we are the main consumers of their economic production. The irony of this argument is that if these countries are not halted from their frenetic economic activity and stepped up consumption of commodities, then there is a good chance of inflation creeping through the commodity sector.

However, the point to make is that the effects of global climate change certainly do have serious economic consequences and excluding it would surely denigrate the prediction.

Other Issues

There are other associate issues. What is the impact of global poverty on future economic activities? Should this be an issue at all? What we don’t observe is the staggering scope of this problem. Let me clarify with a simple example. There are roughly 1.2 billion people in India. Another rough estimate would be to state that about 5% of this population are millionaires (in dollar terms), especially when you factor in that for each Indian Rupee that is accounted for (in the economic system) there is at least two Indian Rupees that are unaccounted (money on which tax has not been paid and has not been laundered either (black money) for but that which circulates in the economy.

Another way of expressing the 5% is to say that there are more millionaires (60 million) in India than there are people in France!! Another 400 million can be considered the middle class. No wonder India is an attractive market to developed nations whose internal markets have become tepid.  However, this also means that the rest of the Indians (about 750 million) live in abject poverty, on a dollar a day. Given that this is an average consumption value, there ought to be about 350 million Indians who live on a lot less than $1 a day. And, this entire population is growing.  In China as in Indonesia; in Bangladesh and in Nigeria. In Brazil and Russia. A growing number of people who are hungry and clamoring for food. People who are adding to the others in claiming land to live on, away from agricultural production. Is there a limit of how many people the world can support before it breaks apart. Does this have any significant (other than the usual Malthusian one) economic impact? It does for sure; much more surely than climate change and swine flu. Yet our models and predictions are oblivious to these possibilities.

SAARS

Physicians and ME-P readers may recalls that about 5-6 years ago, we saw the advent of SAARS, a lethal infection in China and Taiwan, beginning to spread in other parts of the world. There was an immediate and sharp economic impact on many of the industrialized nations. Fortunately for us, the spread of the infection was arrested and the global economy quickly got back in track. Surely, we were lucky. A few years ago, the world witnessed bird flu, an even more lethal viral infection. This too was quickly contained. At some point during the financial meltdown of 2008-09 we witnessed the advent of swine flu, a close relative of the bird flu. This time too we were lucky.

Of course, it is important to note that these infections are one step away from being an epidemic of immense proportions where 100s of millions may perish. If the swine flu was not contained when it appeared in late 2008 – early 2009, the financial meltdown we experienced would seem like a tame event. What happens if the next time and next viral mutation around) we are not that lucky? Should we consider the economic consequence of such an event, albeit within a probability framework?

Non-Economic Issues

As we can see, there are many other noteworthy non-economic issues that can have serious economic impacts.  As a matter of fact, we can all conjure up other examples of non-economic issues at will and make a case for their inclusion because we can so easily rationalize their economic impact. But I have made the point to wrap up the answer to my first question – how good are the economic models? Not much, really.

Join Our Mailing List

Educated ME-P Readers

Since my readers possess financial knowledge and acumen, it is worthwhile for me to allude to the various predictions that are flying about in the economy without having to explain them in great detail. This time around, predictions of economic recovery are in the form of shapes. So now the big question is whether the recovery will look like the shape of a V (a sharp recovery) as compared to a U (a prolonged recession followed by a fairly sharp recovery) or a W (a second round of recession followed by another sharp recovery or like a pair of conjoint Vs (V V). The latest one I had the misfortune to hear about was a square root (√, a V-shaped recovery till a point after which the economy changes very little for a considerable period of time). What is also quite obvious that we can make up many other shapes like the above, using economic (and non-economic) arguments as mentioned earlier but at the end of the day, any one of them has a 50% chance of being right. Because our theories say (yes, the very ones we constructed) that markets are efficient and predictions are futile.

Which brings us to the second question: knowing all this, how important are predictions in the way we live. How much better would our lives be, knowing that one or two of these predictions are right and all others are not? Can we identify the ones that are right?  Most likely not, and definitely much harder than finding good or bad stocks.

Assessment

How would our lives change if we could find that handful of people who predicted correctly and consistently more often than not, if there were such people? Surely, armed with this knowledge, we would be able to exploit the predictions for gain. But, given the odds, it is also quite plain and obvious that finding such people is as difficult as winning the lottery. We know the odds. We continue to admonish our clients who stray in these extreme speculative peripheries. Yet, when it comes to reading about predictions, we continue to play the lottery, in hopes of a windfall. The windfall wills make us richer, but will it make us better or happier?

Note: Dr. Somnath Basu is a professor of Finance at California Lutheran University and the President of Financial Health Technology (www.financialhealthtechnology.com), a personal financial software company.

Channel Surfing the ME-P

Have you visited our other topic channels? Established to facilitate idea exchange and link our community together, the value of these topics is dependent upon your input. Please take a minute to visit. And, to prevent that annoying spam, we ask that you register. It is fast, free and secure.

Conclusion

Your thoughts and comments on this ME-P are appreciated. Feel free to review our top-left column, and top-right sidebar materials, links, URLs and related websites, too. Then, subscribe to the ME-P. It is fast, free and secure.

Speaker: If you need a moderator or speaker for an upcoming event, Dr. David E. Marcinko; MBA – Publisher-in-Chief of the Medical Executive-Post – is available for seminar or speaking engagements. Contact: MarcinkoAdvisors@msn.com

OUR OTHER PRINT BOOKS AND RELATED INFORMATION SOURCES:

Product Details  Product Details

Health Care Costs and the Domestic Budget

The Real Budget Defecit

[By Staff Reporters]

money1The Obama Administration has made comprehensive health insurance, and health care, reform a priority.

The goal is to transform the domestic health-care system so that it improves efficiencies, increases value and provides care for all citizens.

Current Situation

Recently, two important facts that all ME-P readers know, were re-confirmed:

  • Health-care costs are the key to the nation’s economic future.
  • The medical community agrees that great efficiencies are possible in how it is practiced.

Variations

It is well known that health-care costs vary across significant regions of the country, as well as hospitals and doctors within a region – even for patients with a same/similar diagnosis. This must end, according to the Director of the White House Office of Management and Budget [OMB]. Director Peter R. Orszag explained in a WSJ interview below, that practice variation is unnecessary and wasteful, and that evidence-based-medical practices and comparative-effectiveness-research is a good idea for all healthcare stakeholders.

The Baucus-Grassley Policy Options for Expanding Healthcare Coverage report is also included for your review and commentary.

Two New Reports

Wall Street Journal on May 15, 2009.

1. Link http://online.wsj.com/article/SB124234365947221489.html

2. Link: http://finance.senate.gov/press/Bpress/2009press/prb051109.pdf

Assessment

Once accomplished, it is hope that the nation will be on a sustainable fiscal path that builds a new foundation for our economy for generations to come.

Conclusion

And so, your thoughts and comments on this Medical Executive-Post are appreciated. Feel free to review our top-left column, and top-right sidebar materials, links, URLs and related websites, too. Then, be sure to subscribe to the ME-P. It is fast, free and secure.

Link: http://feeds.feedburner.com/HealthcareFinancialsthePostForcxos

Speaker: If you need a moderator or speaker for an upcoming event, Dr. David E. Marcinko; MBA – Publisher-in-Chief of the Executive-Post – is available for seminar or speaking engagements. Contact: MarcinkoAdvisors@msn.com  or Bio: www.stpub.com/pubs/authors/MARCINKO.htm

Subscribe Now: Did you like this Medical Executive-Post, or find it helpful, interesting and informative? Want to get the latest ME-Ps delivered to your email box each morning? Just subscribe using the link below. You can unsubscribe at any time. Security is assured.

Link: http://feeds.feedburner.com/HealthcareFinancialsthePostForcxos

Product DetailsProduct Details

On HIT Cost Savings

Real or Imagined SolutionsUS Capitol

According to David M. Cutler, of the Center for American Progress Fund [CAPF] on May 11, 2009, health care will be the major challenge to the federal budget in coming decades. Rising health costs will account for nearly all of the expected increase in government spending relative to gross domestic product [GDP].

Healthcare Costs and GDP

Health care currently accounts for 16 percent of domestic GDP, and that share is forecast to nearly double in the next quarter century. Spending money on health care is not bad, but wasting money is very bad.

Link: http://www.americanprogressaction.org/issues/2009/05/health_modernization.htmlHIT

HIT to the Rescue

But, $600 billion might be saved over the next ten years, and $9 trillion saved over the next 25 years, if HIT initiatives are used; says the CAPF.

Assessment

Estimates suggest that a third or more of medical spending—perhaps $700 billion per year—is not known to be worth the cost. Wasting hundreds of billions of dollars on inefficient health care is a luxury the country cannot afford.

Conclusion

And so, your thoughts and comments on this Medical Executive-Post are appreciated? Feel free to review our top-left column, and top-right sidebar materials, links, URLs and related websites, too. Then, be sure to subscribe to the ME-P. It is fast, free and secure.

Link: http://feeds.feedburner.com/HealthcareFinancialsthePostForcxos

Speaker: If you need a moderator or speaker for an upcoming event, Dr. David E. Marcinko; MBA – Publisher-in-Chief of the Executive-Post – is available for seminar or speaking engagements. Contact: MarcinkoAdvisors@msn.com  or Bio: www.stpub.com/pubs/authors/MARCINKO.htm

Subscribe Now: Did you like this Medical Executive-Post, or find it helpful, interesting and informative? Want to get the latest ME-Ps delivered to your email box each morning? Just subscribe using the link below. You can unsubscribe at any time. Security is assured.

Link: http://feeds.feedburner.com/HealthcareFinancialsthePostForcxos