MEDICAL EXECUTIVE-POST – TODAY’S NEWSLETTER BRIEFING
***

Essays, Opinions and Curated News in Health Economics, Investing, Business, Management and Financial Planning for Physician Entrepreneurs and their Savvy Advisors and Consultants
“Serving Almost One Million Doctors, Financial Advisors and Medical Management Consultants Daily“

A Partner of the Institute of Medical Business Advisors , Inc.
http://www.MedicalBusinessAdvisors.com
SPONSORED BY: Marcinko & Associates, Inc.
***

http://www.MarcinkoAssociates.com
| Daily Update Provided By Staff Reporters Since 2007. How May We Serve You? |
| © Copyright Institute of Medical Business Advisors, Inc. All rights reserved. 2025 |
REFER A COLLEAGUE: MarcinkoAdvisors@outlook.com
SPONSORSHIPS AVAILABLE: https://medicalexecutivepost.com/sponsors/
ADVERTISE ON THE ME-P: https://tinyurl.com/ytb5955z
Your Referral Count -0-
CITE: https://www.r2library.com/Resource
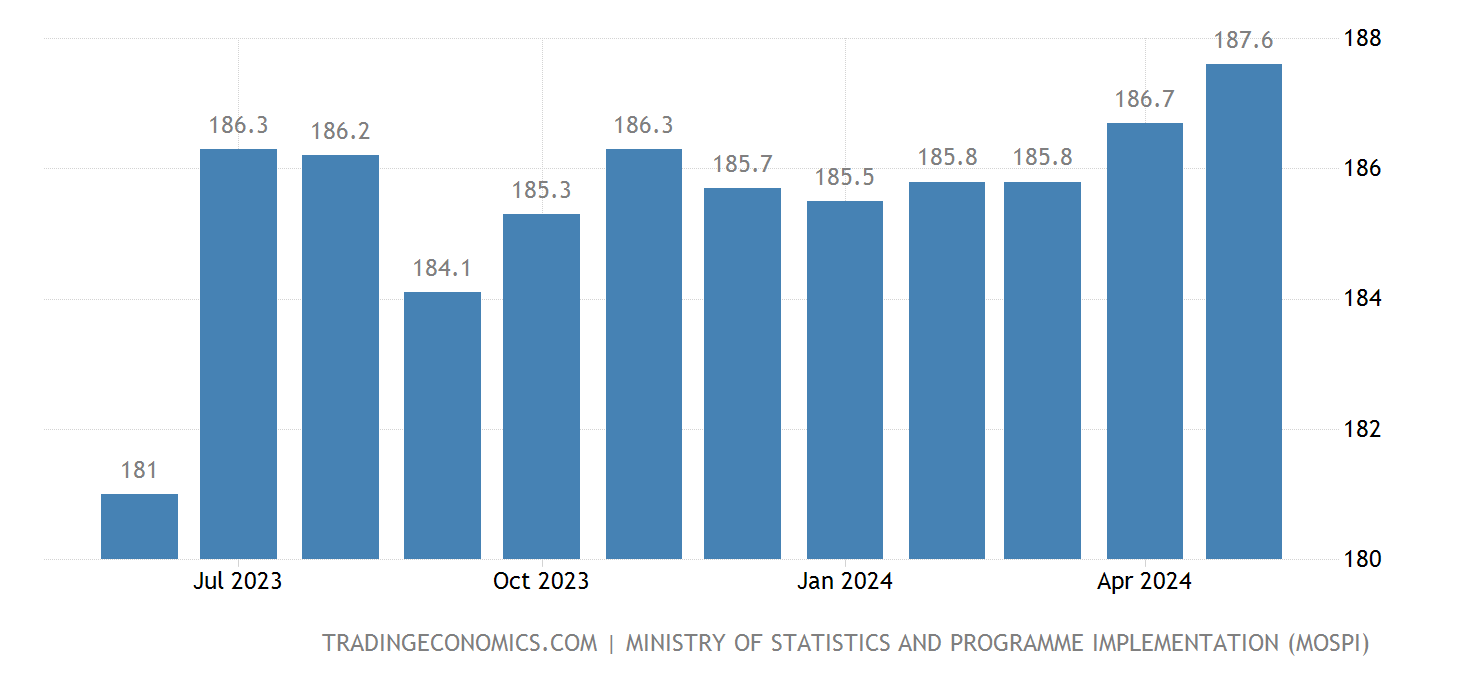
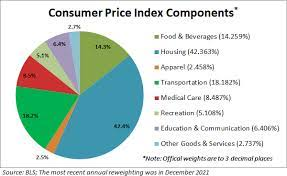
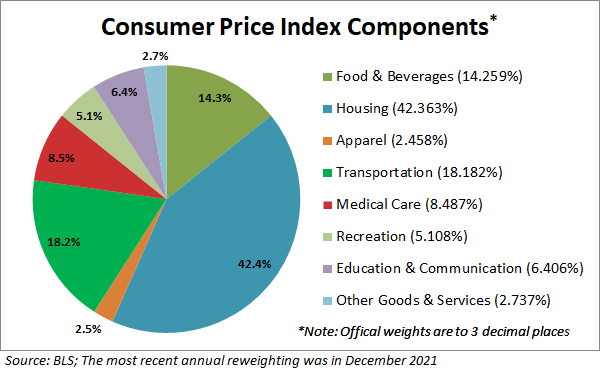
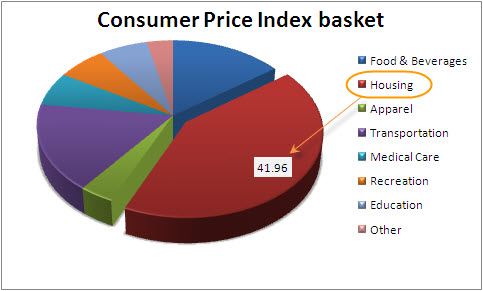
The consumer price index, a broad-based measure of goods and services costs, increased 0.3% on the month, putting the 12-month inflation rate at 2.7%, the Bureau of Labor Statistics reported Tuesday. The numbers were right in line with the Dow Jones consensus. Excluding volatile food and energy prices, core inflation picked up 0.2% on the month, with the annual rate moving to 2.9%, also matching the respective estimates.
CITE: https://tinyurl.com/2h47urt5
Stocks up
- Citigroup gained 3.68% after the big bank reported better-than-expected earnings.
- CoreWeave climbed 6.21% on the news that it will build a $6 billion AI data center in Pennsylvania.
- Trade Desk jumped 6.59% thanks to its inclusion in the S&P 500, replacing the outgoing Ansys.
- The Trump administration has launched a probe into drone imports. Drones use polysilicon, a key ingredient for solar panels, and tariffs on the material could help boost profitability for domestic manufacturers like First Solar, which rose 6.90%.
- National Fuel Gas rose 5.65% after the energy company caught a rare double upgrade from Bank of America analysts, who like the energy company’s improved productivity.
Stocks down
- BlackRock fell 5.86% after the world’s largest asset manager reported that a single client pulled $52 billion last quarter.
- It wasn’t a great day for other big banks: Wells Fargo sank 5.43% after cutting its 2025 net interest income guidance, while JPMorgan Chase lost 0.74% despite beating sales and profit estimates.
- Albertsons tumbled 5.02% even though the grocer reported a solid quarter thanks to strong pharmacy sales and digital revenue.
- Newmont dropped 5.71% on the news that CFO Karyn Ovelmen is leaving the gold miner.
CITE: https://tinyurl.com/tj8smmes
Visualize: How private equity tangled banks in a web of debt, from the Financial Times.
COMMENTS APPRECIATED
PLEASE SUBSCRIBE: MarcinkoAdvisors@outlook.com
Thank You
***
***
***
***
EDUCATIONAL TEXTBOOKS: https://tinyurl.com/4zdxuuwf
***
Share this:

Filed under: "Ask-an-Advisor", finance, Glossary Terms, Information Technology, Investing, Marcinko Associates, Portfolio Management, Recommended Books | Tagged: BLS, Bureau Labor Statistics, Consumer Price Index, CPI, DJIA, DOW, food, FTC, goods, health, inflation, Marcinko, NASA, NASDAQ, oil, PBMs, S&P 500, sevices, textbooks | Leave a comment »