Stock Market Mayhem from 1950 to 2015

 Join Our Mailing List 

Stock Market Mayhem from 1950 to 2015

The Investment Scientist

ImageProxy

Michael Zhuang

[Principal of MZ Capital]

  • Stocks Decline 14% (June 1950 to July 1950) North Korean troops attack along the South Korean border. The U.N. Security Council condemns North Korea. The U.S. gets involved.
  • Stocks Decline 20.7%, (July 1957 to October 1957) The Suez Canal crisis manifests itself, the Soviets launch Sputnik and the U.S. slips into recession.
  • Stocks Decline 26.4% (January 1962 to June 1962) Stocks plunge after a decade of solid economic growth and market boom, the first “bubble” environment since 1929.

***

SHJ

***

Read more of this post

Conclusion

Your thoughts and comments on this ME-P are appreciated. Feel free to review our top-left column, and top-right sidebar materials, links, URLs and related websites, too. Then, subscribe to the ME-P. It is fast, free and secure. 

Speaker: If you need a moderator or speaker for an upcoming event, Dr. David E. Marcinko; MBA – Publisher-in-Chief of the Medical Executive-Post – is available for seminar or speaking engagements. Contact: MarcinkoAdvisors@msn.com

OUR OTHER PRINT BOOKS AND RELATED INFORMATION SOURCES:

***

Comprehensive Financial Planning Strategies for Doctors and Advisors: Best Practices from Leading Consultants and Certified Medical Planners™

***

Downhill Racing Meets Value Investing

Join Our Mailing List

More on Value Investing

vitaly

By Vitaliy Katsenelson CFA

I wrote this article in May. Every time it was destined to be published in the pages of Institutional Investor, it got bumped by another, more timely one I had written. Finally, when a space opened in September, the market had taken a major dive, and what was supposed to be an “evergreen” article was suddenly out of touch with reality.

Here is the irony: This piece addresses complacency, but its author was complacent too. The X-mass market has recouped its summer losses, and this article is relevant again.

The Skier

I am a skier. When someone says this, you assume he or she is good. Well, I thought I was good. I was not Lindsey Vonn, but I had the technique down. I’d be the fastest person going down the mountain, always waiting for my friends at the bottom. Then, at the beginning of last season, I went skiing with my kids at Vail. It had snowed nonstop for a few days. Vail is a very large resort, and the mountain crew could not keep up with the snow, so I found myself skiing on unusually ungroomed slopes in powder more than knee-deep. Suddenly, something changed. I could not ski. I could barely make turns. I was falling multiple times per run. My kids, including my nine-year-old daughter, Hannah, were now waiting for me as I dug myself out of pile after pile of snow. My technique — along with my confidence — was gone. The discomfort froms constant falling turned into fear. I was ready to go back to the hotel after only two hours on the slopes. I was devastated. It was as if I had never skied.

The Ski Instructor

So I talked to a ski instructor about this incident. He told me that I’m a “good skier” on groomed slopes because they allow me to go fast without trying hard. Speed covers up a lot of mistakes and lack of skill. Skiing in powder requires different skis — not the skis I had — but more importantly, it slows you down and makes you rely on skills that I thought I had but didn’t.

The FED

During the past six years, the Federal Reserve neatly groomed, manicured and then finely polished investment slopes for all asset classes by lowering interest rates to unprecedented levels — providing a substantial accelerant that indiscriminately drove valuations of all assets higher. But ubiquitously rising valuations cover up a lot of mistakes and often a lack of skill. Whether you had a rigorous investment process or were throwing darts, over the past six years it hardly mattered — you made money. Bull markets don’t last forever, and this one is not an exception. Stock valuations (price-to-earnings) are just like a pendulum, swinging from one extreme to another.

Modernity

Today the stocks in the S&P 500 index trade at about 50 percent above their average valuation (if you adjust earnings down for very high corporate margins). Historically, above-average valuations have always been followed by below-average ones — taking away the riches that the previous years provided.

In other words, at some point it is going to snow and snow hard. Just as I, the great skier, found myself overconfident and unable to deal with the new terrain, investors will find themselves doing face-plants when the stock market turns from bull to bear. But here is great news:

Now the stock slopes are still finely groomed with stocks near all-time highs, and we all are given a unique opportunity to make adjustments to our portfolios and investment process. You should start by carefully analyzing each stock position in your portfolio. No drooling over how each of them did for you in the past. Drawing straight lines from the past into the future is very dangerous.

The Future

Instead, focus on the future — a future in which average stock valuations will likely be lower. Returns for a stock are driven by three variables: earnings growth, change in P/E and dividend yield. You should impartially examine each variable to determine if a stock deserves to be in your portfolio.

Then make one of three decisions: buy (more), hold or sell. Just remember, hold is a decision. If you choose not to sell an overvalued stock, one that has low or negative expected returns in the long run, that is a decision. We must all reexamine and future-proof our investment process. Six years of rewards and no risk will loosen the process of even the most disciplined investor.

Finally, if you are feeling very confident about your investment prowess today, take a moment to relive that gut-wrenching feeling you had the last time the stock market took a 20 percent dive. This will reset your confidence to the appropriate level and help you to avoid the mistakes that come from focusing too much on reward and too little on risk.

***

penn station

***

P.S. I took the kids skiing at Beaver Creek a week ago, for the first time this season. My daughter Hannah, who will be ten in a few weeks, has magically improved over the summer. However, Jonah, who is an amazing skier, has completely lost his form. He grew five or six inches since last spring — he’s 14 and pushing 6 feet now. His center of gravity has shifted, and he is still adjusting his technique to his new, oversized body.

Assessment

As a father, I smile when I see Hannah beating Jonah down the slope. Jonah, like any teenager, needs to be humbled. My skiing? The slopes were perfectly groomed. I was awesome! I just hope it doesn’t snow.

***

ABOUT

Vitaliy N. Katsenelson, CFA, is Chief Investment Officer at Investment Management Associates in Denver, Colo. He is the author of Active Value Investing (Wiley 2007) and The Little Book of Sideways Markets (Wiley, 2010).

Conclusion

Your thoughts and comments on this ME-P are appreciated. Feel free to review our top-left column, and top-right sidebar materials, links, URLs and related websites, too. Then, subscribe to the ME-P. It is fast, free and secure.

Speaker: If you need a moderator or speaker for an upcoming event, Dr. David E. Marcinko; MBA – Publisher-in-Chief of the Medical Executive-Post – is available for seminar or speaking engagements. Contact: MarcinkoAdvisors@msn.com

OUR OTHER PRINT BOOKS AND RELATED INFORMATION SOURCES:

***

[PHYSICIAN FOCUSED FINANCIAL PLANNING AND RISK MANAGEMENT COMPANION TEXTBOOK SET]

   Risk Management, Liability Insurance, and Asset Protection Strategies for Doctors and Advisors: Best Practices from Leading Consultants and Certified Medical Planners™ Comprehensive Financial Planning Strategies for Doctors and Advisors: Best Practices from Leading Consultants and Certified Medical Planners™

[Dr. Cappiello PhD MBA] *** [Foreword Dr. Krieger MD MBA]

***

FORECASTS – IT’S THAT TIME OF THE YEAR FOR [Physician] INVESTORS

Join Our Mailing List 

No, not the holidays!

Art

By Arthur Chalekian GEPC

[Financial Consultant]

 ***

It’s the time when physician investors begin to consider pundits’ forecasts for the coming year.

Here are a few of those forecasts:     

1. “Flat is the new up,” was the catch phrase for Goldman Sachs’ analysts last August, and their outlook doesn’t appear to have changed for the United States. In Outlook 2016, they predicted U.S. stocks will have limited upside next year and expressed concern that positive economic news may bring additional Fed tightening. Goldman expects global growth to stabilize during 2016 as emerging markets rebound, and Europe and Japan may experience improvement.

2. Jeremy Grantham of GMO, who is known for gloomy outlooks, is not concerned about the Federal Reserve raising rates, according to Financial Times (FT). FT quoted Grantham as saying,

“We might have a wobbly few weeks … but I’m sure the Fed will stroke us like you wouldn’t believe and the markets will settle down, and most probably go to a new high.”

Grantham expects the high to be followed by a low. He has been predicting global markets will experience a major decline in 2016 for a couple years, and he anticipates the downturn could be accompanied by global bankruptcies.

3. PWC’s Trendsetter Barometer offered a business outlook after surveying corporate executives. After the third quarter of 2015, it found:

“U.S. economic fundamentals remain strong, but markets and executives like predictability, and that’s not what we’ve been getting lately … Trendsetter growth forecasts are down, so are plans for [capital expenditure] spending, hiring, and more. It doesn’t help that we’ve entered a contentious 2016 election season …”

4. The Economist had this advice for investors who are reviewing economic forecasts:

“Economic forecasting is an art, not a science. Of course, we have to make some guess. The average citizen would be well advised, however, to treat all forecasts with a bucket (not just a pinch) of salt.”

***

0be5f030277425_561bf03bbcd62

[End 2015 – Begin 2016]

***

Assessment

Doctor – What are your stock market predictions for 2016?

Conclusion

Your thoughts and comments on this ME-P are appreciated. Feel free to review our top-left column, and top-right sidebar materials, links, URLs and related websites, too. Then, subscribe to the ME-P. It is fast, free and secure.

Speaker: If you need a moderator or speaker for an upcoming event, Dr. David E. Marcinko; MBA – Publisher-in-Chief of the Medical Executive-Post – is available for seminar or speaking engagements. Contact: MarcinkoAdvisors@msn.com

OUR OTHER PRINT BOOKS AND RELATED INFORMATION SOURCES:

***

Risk Management, Liability Insurance, and Asset Protection Strategies for Doctors and Advisors: Best Practices from Leading Consultants and Certified Medical Planners™8Comprehensive Financial Planning Strategies for Doctors and Advisors: Best Practices from Leading Consultants and Certified Medical Planners™

***

14 Smart Things to Consider for Your 2015 Year-End Financial Checklist

Join Our Mailing List

Be Ready for a Great 2016!

pat

[By Patrick Bourbon CFA]

1. IRA – 401(k) / 403(b) retirement accounts – Are you on track for a comfortable retirement?   You could increase the funding of your IRA and company retirement plan like a 401(k) or 403(b) accounts.   401(k) and 403(b) accounts allow individuals younger than 50 to contribute $18,000 each year, and individuals 50 and older to contribute $24,000. Some plans allow workers to make additional contributions of after-tax money.

For those under 50, the maximum is $53,000 for 2015. Doing so does not reduce your taxable income, but taxes are deferred on any earnings that the after-tax money makes. Later, some people roll these contributions into a Roth IRA, tax-free so the money would then grow tax-free.   Traditional and Roth IRAs allow individuals younger than 50 to contribute $5,500 each year and individuals 50 and older to contribute $6,500. Even if you earn too much to contribute to a Roth IRA directly, you can open a traditional nondeductible IRA and convert it to a Roth; there is no income limit on traditional nondeductible IRAs or conversions.    Returns generated in IRA and 401(k) / 403(b) accounts compound tax-free over their entire life.

2. Start tax planning! It’s not too early to think about taxes. Asset location & Tax efficiency   Review your taxable and non-taxable accounts to ensure they are optimized for tax efficiency. If you have foreign bank accounts, make sure you comply with FATCA and FBAR (forms FinCEN 114, 8938, 8621…). If you have forgotten, you may look into the Offshore Voluntary Disclosure Program (OVDP) or Streamlined procedures.

3. Portfolio rebalancing   Make sure you have rebalanced your portfolios to keep them in line with your goals, time horizon and risk tolerance. The market movements this summer may have thrown off your portfolio balance between stocks and bonds.   David Swensen, the Chief Investment Officer at the Yale Endowment, performed an analysis that showed optimal rebalancing could add 0.4% to your annual return.

4. Harvest your capital losses   Maybe it is time to sell some funds, ETF, stocks to generate some capital losses?   Tax-loss harvesting is a method of reducing your taxes by selling an investment that is trading at a significant loss.  Find out if you have any loss carryovers from prior years to be applied against capital gains (from sale of funds, ETF, stocks… in your taxable/brokerage accounts). If your current year’s capital losses exceed your capital gains, you have a net capital loss. You can use up to $3,000 of that loss ($1,500 if you are married filing separately) to offset other taxable income such as your salaries, wages, interest and dividends. If the capital loss is more than $3,000, you can carry over the excess and apply it against capital gains next year.

5. Emergency fund   Don’t forget to establish or tune up your emergency fund. This is a good time to set aside money for next year’s cash needs. It is an account that is used to set aside funds to be used in an emergency, such as the loss of a job, an illness or a major expense.

6. Review your insurance policies   Do you have a life, disability and long term care insurance? Make sure you and your loved ones are well protected if something happens to you. Your life may have changed (birth, marriage …). If you do have enough coverage it is also a good time simply to review the different types of coverage you have. Whole life or Variable Universal Life may help you reduce your taxes.

7. Health Spending Account   Did you maximize your contribution to your healthcare HSA? The interest and earnings in this account are tax free! The maximum contribution for 2015 is $3,350 for an individual and $6,650 for a family ($1,000 catch-up over 55). The contributions are tax deductible and withdraws are non-taxable if they are used for medical expenses. Over the age of 65 you can withdraw funds at your ordinary tax rate (if the distribution is not used for unreimbursed medical expenses). Fidelity estimates that a 65-year-old couple retiring in 2014 will need $220,000 for health care costs in retirement, in addition to expenses covered by Medicare. The HSA can be a great source of tax-free money to pay those bills.

8. Required Minimum Distribution   If you are age 70.5 or older, remember to take your required minimum distribution to avoid a potential 50% penalty.

9. 529 Plan   Did you contribute to your 529 educational plan for your child/children?   You can contribute $14,000 per year (annual limit) for each parent or you can pre-fund in a single instance up to five years’ worth of contributions, up to $70,000 (5 x $14,000). Together, that means a married couple can open a 529 plan with $140,000.   Money saved in a 529 plan grows tax-free when used for eligible educational expenses, and some states have additional tax benefits for residents who contribute to a plan in that state.

10. Determine your net worth   Add up what you own (home, car, savings, investments…) and subtract what you owe (mortgage, loans, credit cards, …).   This will allow you to track your progress year to year. It may also give you some incentive to save more and create a better budget for next year.

11. Check your credit score Go to annualcreditreport.com and request a free credit report from each of the three nationwide credit reporting agencies. You’re entitled to one free report from each agency every 12 months.

12. Check your beneficiaries   You can check the beneficiaries on your retirement accounts or insurance policies at any time, but it’s a good idea to do this at least annually.

13. Update your estate plan   New baby? Newly married or divorced? Make sure your beneficiary designations reflect any changes. Don’t yet have an estate plan? Make that a new year’s resolution!  Estate planning may include updating or establishing a “will” or trust that can help avoid public disclosure of assets in probate.

14. Spending and automated savings – You want to look ahead   Did you review your budget and set up automated savings?   You may have started the year with a clear budget, but did you to stick to it?    Fall can be a good time of the year for your financial checkup and to reflect on your spending and develop a budget for next year.  It is also a very good time to put whatever you can on automatic. Bills, recurring payments, even savings—the more you can put on auto pay now, the easier your financial life will be next year.   With this year’s facts and figures in front of you, it will be easier to plan and prioritize your expenditures for next year.

Assessment

198174

Conclusion

Your thoughts and comments on this ME-P are appreciated. Feel free to review our top-left column, and top-right sidebar materials, links, URLs and related websites, too. Then, subscribe to the ME-P. It is fast, free and secure.

Speaker: If you need a moderator or speaker for an upcoming event, Dr. David E. Marcinko; MBA – Publisher-in-Chief of the Medical Executive-Post – is available for seminar or speaking engagements. Contact: MarcinkoAdvisors@msn.com

OUR OTHER PRINT BOOKS AND RELATED INFORMATION SOURCES:

 ***

Comprehensive Financial Planning Strategies for Doctors and Advisors: Best Practices from Leading Consultants and Certified Medical Planners(TM)

Front Matter with Foreword by Jason Dyken MD MBA

logos

“BY DOCTORS – FOR DOCTORS – PEER REVIEWED – FIDUCIARY FOCUSED

***

ME-P Health Economics, Financial Planning & Investing, Medical Practice, Risk Management and Insurance Textbooksfor Doctors and Advisors

ME-P At Your Service!

***

[PHYSICIAN FOCUSED FINANCIAL PLANNING AND RISK MANAGEMENT COMPANION TEXTBOOK SET]

  Risk Management, Liability Insurance, and Asset Protection Strategies for Doctors and Advisors: Best Practices from Leading Consultants and Certified Medical Planners™Comprehensive Financial Planning Strategies for Doctors and Advisors: Best Practices from Leading Consultants and Certified Medical Planners™

[HOSPITAL OPERATIONS, ORGANIZATIONAL BEHAVIOR AND FINANCIAL MANAGEMENT COMPANION TEXTBOOK SET]

Product DetailsProduct Details

[Foreword Dr. Phillips MD JD MBA LLM] *** [Foreword Dr. Nash MD MBA FACP]

[HEALTH INSURANCE, MANAGED CARE, ECONOMICS, FINANCE AND HEALTH INFORMATION TECHNOLOGY COMPANION DICTIONARY SET]

      Product DetailsProduct DetailsProduct Details

[Mike Stahl PhD MBA] *** [Foreword Dr.Mata MD CIS] *** [Dr. Getzen PhD]

***

Product Details

http://www.BusinessofMedicalPractice.com

***

Dr. David Edward Marcinko, editor-in-chief, is a next-generation apostle of Nobel Laureate Kenneth Joseph Arrow, PhD, as a health-care economist, insurance advisor, financial advisor, risk manager, and board-certified surgeon from Temple University in Philadelphia. In the past, he edited eight practice-management books, three medical textbooks and manuals in four languages, five financial planning yearbooks, dozens of interactive CD-ROMs, and three comprehensive health-care administration dictionaries. Internationally recognized for his clinical work, he is a distinguished visiting professor of surgery and a recipient of an honorary Bachelor of Medicine–Bachelor of Surgery (MBBS) degree from Marien Hospital in Aachen, Germany. He provides litigation support and expert witness testimony in state and federal court, with medical publications archived in the Library of Congress and the Library of Medicine at the National Institutes of Health.

***

Why we build [business and/or valuation] investment models?

Join Our Mailing List 

Qualitatively and quantitatively intensive!

By Vitaliy N. Katsenelson CFA 

vitalyOur investment process at IMA is both qualitatively and quantitatively intensive. Throughout the course of a year we look at hundreds of companies. Most of them receive only a cursory look – we don’t like the business, the valuation is too stretched, or we simply have no insight into the business. We usually glance at them and move on.

But, if we really like the business and/or its valuation, we build a model. Often, just from a cursory look we know that the stock is not cheap enough, but if we really (really!) like the business we’ll invest the time to model it so we can understand it better and set a price at which we want to buy it (and then wait).

***

We build models

***

We build a lot of models. We built over a hundred models last year (we bought only a handful of stocks). Building models is important for us. Models help us to understand businesses better. They provide insights as to which metrics matter and which don’t. They allow us stress test the business: we don’t just look at the upside but spend a lot of times looking at the downside – we try to “kill” the business. We usually try to drill down to essential operating metrics. If it is a convenience store retailer, we’ll look into gallons of gas sold and profit per gallon. If it is a driller (see our Helmerich & Payne analysis), we look at utilization rates, rigs in service, average revenue per rig per day, etc.

***

In the past, when we owned Joseph A. Banks, a model helped us understand the impact maturation of its new stores had on same-store sales (PDF, see slide 49). Half of Joseph A. Banks stores were less than five years old, and their maturation drove significant same-store sales increase for years.

***

We looked at American Express before the crisis, which gave us insight into inflated profit margins of the financial sector, and thus we avoided for the most part the carnage in the financials. We thought American Express stock was not cheap enough at the time, but we learned that Amex’s high swipe-fee revenue provided an important buffer to help the company absorb significant loan losses. Amex could have withstood over 10% loan losses on its credit card portfolio and still have remained profitable. This insight gave us the confidence to buy Amex during the crisis.

***

value

***

Models are important because they help us remain rational. It is only the matter of time before a stock we own will “blow up” (or, in layman’s terms, decline). We can go back to our model and assess whether the decline is warranted. The model then gives us the confidence to make a rational (very key word) decision: buy more, do nothing, or sell.

***

Assessment

***

Models are frameworks that help us think about the businesses we analyze. We are always aware of John Maynard Keynes’ expression, “I’d rather be vaguely right than precisely wrong.” Models are not a panacea, but they are an important and often invaluable tool. However, models are only as good as their builders and the inputs to them.

***

ABOUT

Vitaliy N. Katsenelson, CFA, is Chief Investment Officer at Investment Management Associates in Denver, Colo. He is the author of Active Value Investing (Wiley 2007) and The Little Book of Sideways Markets (Wiley, 2010).  His books have been translated into eight languages.  Forbes called him – the new Benjamin Graham.

***

Conclusion

Your thoughts and comments on this ME-P are appreciated. Feel free to review our top-left column, and top-right sidebar materials, links, URLs and related websites, too. Then, subscribe to the ME-P. It is fast, free and secure.

Speaker: If you need a moderator or speaker for an upcoming event, Dr. David E. Marcinko; MBA – Publisher-in-Chief of the Medical Executive-Post – is available for seminar or speaking engagements. Contact: MarcinkoAdvisors@msn.com

OUR OTHER PRINT BOOKS AND RELATED INFORMATION SOURCES:

Comprehensive Financial Planning Strategies for Doctors and Advisors: Best Practices from Leading Consultants and Certified Medical Planners(TM)

Front Matter with Foreword by Jason Dyken MD MBA

logos

“BY DOCTORS – FOR DOCTORS – PEER REVIEWED – FIDUCIARY FOCUSED”

***

More Practitioners, Prognosticators and Portfolio Pain

Join Our Mailing List

 “Altitude Sickness,” or Value Asphyxiation?

vitaly[By Vitaliy N. Katsenelson CFA]

“Asphyxiation is a condition in which the body doesn’t receive enough oxygen.”

That’s how I started another column awhile back , in which I explained how the recent U.S. equity market highs have been creating “altitude sickness,” or value asphyxiation, for investors. If you look down from 30,000 feet, the market is trading at a significant premium to its average long-term valuation, especially if you normalize earnings for sky-high profit margins.

The Trench View

The view from the trenches is not much different. I spend a lot of time looking for new stocks, either by screen or by reading or talking to other value investors. We are all having a hard time finding many stocks of interest. In fact, we’ve been doing a lot more selling than buying.

I often get asked a question: Are we in a bubble? Bubble is a word that has been thrown around a lot lately. There may be an academic definition of what a bubble is — probably something to do with valuations at least a few standard deviations from the mean — but I don’t really care what it is. (Only academics believe in normal distributions.)

The Practitioner’s View

From the practitioner’s perspective, a bubbly valuation occurs when the price-earnings ratio of a company is so high that its earnings will have a hard time growing into investors’ expectations. In other words, the stock is so expensive that investors holding it will find it difficult to realize a positive return for a long time (think of Cisco Systems, Microsoft and Sun Microsystems in 2000). There are some bubbly stocks in the market today. Most years you see some, but today there are probably a few more than usual.

We see a lot of overvalued or fully valued stocks. Expectations (valuations) of those stocks have already more than priced in rosy earnings growth scenarios. If these scenarios play out, investors will likely make very little money, as earnings growth will merely offset P/E compression. But here is where it gets interesting: The line between overvalued and bubbly stocks is often very murky. If the economy’s growth is lower than expected or corporate profit margins revert toward the mean (or, in the situation we have today, decline), the return profiles of these stocks will not be substantially different from those of the bubbly ones. Unfortunately for the value-asphyxiated investor, there are a lot of stocks that fall into this overvalued bucket.

It is very hard for investors to remain disciplined and stick to an investment process. Selling overvalued stocks is hard, because every sell decision brings consequent pain as overvalued stocks that are not aware you’ve sold them keep on marching higher. Just as Pavlov’s dog responded to a bell, the pain of selling teaches us not to sell.

More Pain

If that pain were not enough, cash keeps burning a hole in our portfolios. Cash doesn’t rise in value when everything else is rising; thus investors feel forced to buy. When you are forced into a buy or sell decision, the outcome will usually not be good. Forced buy decisions are usually bad buy decisions. Just because a stock looks less bad than the rest of the market doesn’t make it a good stock. Maybe its peer is trading at 23 times earnings and your pick is trading at “only” 19. Such relative logic is dangerous today, because it anchors you to a transitory environment that may or may not be there for you in the future (most likely not).

***

investmentcenter5

***

An Annoying Phase

We are in the most annoying phase of the investing calendar: the month when every market strategist and his dog have to make a prediction as to what the market will do next year. To be right in forecasting, you have to predict often. And market strategists do. In fact, they predict so often that no one remembers how often their predictions worked out. I am not knocking the prognosticators: That is their job. They predict and sound smart doing it — just like it’s the barber’s job to cut your hair and pretend he is concentrating on not cutting off your ear.

It is your job, however, not to pay attention to the predictors. They simply don’t know. They may have a gut feeling, but that feeling is worth as much as you pay for it — very little. To time the market, you have to forecast what the economy will do, which is also very difficult. The Fed has 450 economists working full time on that (half of them are Ph.D.s, but I am not going to hold it against them), and they have an amazingly poor track record. Then you have to figure out how other market participants will respond to the economics news — and that is incredibly difficult. Let’s say you nailed both of these tasks. You still need to predict the multitude of random events — a few of which may be very large black swans — that will show up in the next 12 months. There is a reason why they are called “random.”

Assessment

Though it is dangerous to drink the market’s Kool-Aid and celebrate, it is not time to be gloomy either. There is good news for all of us: Cyclical bull markets are here to absolve us from our “buy” sins. Not every stock in your portfolio is marching in rhythm to its fundamentals. Indeed, this market has lifted many stocks while divorcing them from their weak fundamentals. This absolution is temporary: Take advantage of it.

ABOUT

Vitaliy N. Katsenelson, CFA, is Chief Investment Officer at Investment Management Associates in Denver, Colo. He is the author of Active Value Investing (Wiley 2007) and The Little Book of Sideways Markets (Wiley, 2010).  His books have been translated into eight languages.  Forbes called him – the new Benjamin Graham.

Conclusion

Your thoughts and comments on this ME-P are appreciated. Feel free to review our top-left column, and top-right sidebar materials, links, URLs and related websites, too. Then, subscribe to the ME-P. It is fast, free and secure.

Speaker: If you need a moderator or speaker for an upcoming event, Dr. David E. Marcinko; MBA – Publisher-in-Chief of the Medical Executive-Post – is available for seminar or speaking engagements. Contact: MarcinkoAdvisors@msn.com

OUR OTHER PRINT BOOKS AND RELATED INFORMATION SOURCES:

Comprehensive Financial Planning Strategies for Doctors and Advisors: Best Practices from Leading Consultants and Certified Medical Planners(TM)

***

The Central Banks are at it Again!

Join Our Mailing List
Central banks were at it again – and markets loved it!
Art
 ***
By Arthur Chalekian GEPC [Elite Financial Partners]
 ***
Several weeks ago, European Central Bank (ECB) President Mario Draghi surprised markets when he indicated the ECB’s governing council was considering cutting interest rates and engaging in another round of quantitative easing.
The Economist explained European monetary policy was heavily tilted toward growth before the announcement:
 ***
“The ECB is already delivering a hefty stimulus to the Euro area, following decisions taken between June 2014 and early 2015. It has introduced a negative interest rate, of minus 0.2%, which is charged on deposits left by banks with the ECB. It has also been providing ultra-cheap, long-term funding to banks provided that they improve their lending record to the private sector. And, most important of all, in January it announced a full-blooded program of quantitative easing (QE) – creating money to buy financial assets – which got under way in March with purchases of €60 billion ($68 billion) of mainly public debt each month until at least September 2016.”
***
Despite these hefty measures, recovery in the Euro area has been anemic, and deflation remains a significant issue. According to Draghi, Euro area QE is expected to continue until there is “a sustained adjustment in the path of inflation.” Europe is shooting for 2 percent inflation, just like the United States.
***
The People’s Bank of China (PBOC) eased monetary policy last week, too. On Monday, data showed the Chinese economy grew by 6.9 percent during the third quarter, year-over-year. Projections for future growth remain muted, according to BloombergBusiness. On Friday, the PBOC indicated it was cutting interest rates for the sixth time in 12 months.
***
stock-exchange
 ***
U.S. markets thrilled to the news. The Dow Jones Industrial Average, Standard & Poor’s 500 Index, and NASDAQ were all up more than 2 percent for the week. Many global markets delivered positive returns for the week, as well.
***
Conclusion
Your thoughts and comments on this ME-P are appreciated. Feel free to review our top-left column, and top-right sidebar materials, links, URLs and related websites, too. Then, subscribe to the ME-P. It is fast, free and secure.

Speaker: If you need a moderator or speaker for an upcoming event, Dr. David E. Marcinko; MBA – Publisher-in-Chief of the Medical Executive-Post – is available for seminar or speaking engagements. Contact: MarcinkoAdvisors@msn.com

OUR OTHER PRINT BOOKS AND RELATED INFORMATION SOURCES:

***

[PHYSICIAN FOCUSED FINANCIAL PLANNING AND RISK MANAGEMENT COMPANION TEXTBOOK SET]

  Risk Management, Liability Insurance, and Asset Protection Strategies for Doctors and Advisors: Best Practices from Leading Consultants and Certified Medical Planners™ Comprehensive Financial Planning Strategies for Doctors and Advisors: Best Practices from Leading Consultants and Certified Medical Planners™

 ***

On Value Investor Guy Spier

Join Our Mailing List

What I Learned from Value Investor Guy Spier 

By Vitaliy N. Katsenelson CFA

***

A few months ago I was asked by the CFA Institute to give talks to CFA societies in London (October 27), Zurich (October 29) and Frankfurt (November 3). I enjoy giving occasional talks (but only a few a year, otherwise they become a chore). I also love Europe — history, old buildings and cultures, museums, sometimes a mild adventure. But this offer was much more interesting — I was asked to give a joint presentation with Guy Spier.

About  Guy

Guy Spier is a tremendous value investor who happens to be a good friend whose company I truly enjoy. He is the most cosmopolitan person I know. He was born in South Africa, spent his childhood in Iran and Israel, received his bachelor’s degree from Oxford and MBA from Harvard, lived in New York and in 2008 got sick of the New York hedge fund rat race and moved with his family to Zurich. His wife, Lory, is Mexican, so in addition to being fluent in languages of all the above-mentioned countries, he romances in Spanish.

Last year Guy published a book, The Education of a Value Investor: My Transformative Quest for Wealth, Wisdom, and Enlightenment. It is not a traditional investing book. In fact, I’ll say that differently: This is the most untraditional book on investing you’re likely to run into. It is a self-effacing memoir of Guy’s transformation from a Gordon Gekko wannabe who believes that his Ivy League education entitles him to Wall Street riches to a committed follower of Warren Buffett and his sidekick, Charlie Munger.

It must have taken a lot of guts and self-confidence (overcoming a lot of self-doubt) to write this book. To be honest, I am not sure I could have written it. It is one thing to strive for intellectual honesty; it is another to unearth and expose one’s own greed, arrogance and envy. Many of us are trying to hide such character traits in plain sight, never mind telling the world about them in a popular book.

After all, Guy is not writing about a fictional character; he is writing about himself. The humility he displays is what makes the book so effective — you can clearly follow the deliberate transformation of a cockroach (the Wall Street version of a caterpillar) into a butterfly.

This memoir is able to achieve something that many other investments books don’t (including my own): It reveals the real, practical, behavioral side of investing, not the way you read about it in behavioral finance textbooks but the raw emotions every investor experiences.

There are a lot of lessons we can learn from Guy. The first one — and, for me, the most important one — is that environment matters.

***

value

[Eye for Value]

Enter Dan Ariely PhD

Dan Ariely PhD, the well-known behavioral economist, was interviewed on Bloomberg Television and asked, What can one do to lose weight? He said, Start with the environment around you. If you come to work and there is a box of doughnuts on your desk, losing weight is going to be difficult. Also, look in your fridge: All the stuff that is probably not good for your diet is staring you in the face, whereas the fruits and vegetables that are essential to healthy eating are buried in the hard-to-access bottom drawers.

The same applies to investing: We may not notice it, but the environment around us impacts our ability to make good decisions. Guy writes, “We like to think that we change our environment, but the truth is that it changes us. So we have to be extraordinarily careful to choose the right environment — to work with, and even socialize with, the right people.”

I have found that checking the prices of stocks I own throughout the day shrinks my time horizon, impacts my mood and wastes my brain cells as I try to interpret data that have very little information. I am getting better; I am already down checking prices only once a day. My goal is to do it just once every few days.

Guy is ahead of me: He checks them once a week. Recently, I put in price alerts for stocks my firm owns or follows. If a stock price changes more than 10 percent or crosses a certain important (buy or sell) point, I’ll get an e-mail alert.

Guy finds that he isn’t effective when he gets to the office because of external distractions. In his Zurich office he has a quiet room that he calls the library. It doesn’t have phones or computers, and this is where he reads, thinks and naps. Here in Denver, I have a lawn chair (bought at Costco for $50) that I take outside to sit on, put on headphones, and listen to music and read. My friend Chris goes to Starbucks or the local library in the morning for four hours before he goes to his office, and that’s where he does his reading. The key is to figure out what works for you and try not to fight your external environment.

Another lesson I have learned is that misery loves company. I was talking to Guy about his book, and he told me that people who love the book appreciate the fact that he is so honest about the emotions that consume him when he is struggling in the stock market. As investors, we often put on a brave face, but if we aren’t emotionally honest, our opinion of ourselves, our self-worth, may fluctuate with the performance of our portfolio.

Personally, I can really relate to this. When I read Guy’s book the first time (I’ve read it twice), I was going through a tough time with my portfolio. I found this book extremely therapeutic. In fact, I recommended it to a friend of mine who was going through a similar rough patch.

Another lesson:

Surround yourself with the right people. Friendships matter. I’ve been blatantly plagiarizing Guy on this for years. Guy created a conference called VALUEx Zurich, a gathering of like-minded people who get together and share investment ideas. I attended the very first one in 2010, and since then I have hosted a very similar event, VALUEx Vail, every year in June.

Guy has a latticework group of eight investors that meets every quarter and discusses the stock market, the investment process and personal issues. I’ve copied that, too. Four of us got together in Atlanta in October. We visited a few companies and debated stocks, industry trends, diets, women . . . okay, you get the point. That was our first latticework event, but I hope we’ll meet a few times a year.

Attending Guy’s conference in Zurich and organizing VALUEx Vail have resulted in enduring friendships. These conferences allowed me to create a large network of like-minded investors I talk to regularly. Every member of my latticework group I met at VALUEx Vail.

(A short side note: One of the most important things we can do as parents of teenage kids is to make sure they have good friends. That’s paramount. We as parents lose influence on our kids when they become teenagers. Their friends have a disproportionately larger impact on their choices than we do. We can influence the environment around our kids by helping them select friends.)

And then there are thank-you cards. Over the years Guy has written tens of thousands of them. He is indiscriminate about them — at one point he wrote to every employee at a boutique hotel he stayed in. All right, maybe he took it too far that time. But, writing a thank-you card to value investor Mohnish Pabrai changed his life. He attended Pabrai Investment Funds’ annual meeting in Chicago. After the meeting he sent Pabrai a thank-you note. A few months later Pabrai came to New York and invited Guy to dinner. This was the start of the Spier-Pabrai bromance. Thank-you cards work because so few people write them. They leave a lasting impression on the receiver because they say, “I like you. You are important to me.”

***

stock-exchange

[Stock-Exchanges]

Mentors

The last point is, Be yourself. Having mentors is important. For many value investors, Buffett and Munger are our north stars. There are lots of things we can learn from them. But we also have to realize that we must be ourselves, because we are not them. I remember reading a long time ago that Buffett did not do spreadsheets. That impacted me for a few months — I stopped building models and creating spreadsheets. I thought, If Buffett doesn’t do it, I shouldn’t do it either. Wrong.

Buffett is a lot smarter than I am; he is able to analyze companies in his head. He is Buffett. I have found that spreadsheets work for me because they help me think. When Buffett and I look at a company philosophically, we are looking for the same things, but I need a computer to assist me, and he doesn’t.

Mohnish Pabrai owns just a handful of stocks. Guy, on the other hand, knows that he would not be able to be a rational decision maker if he had only a handful of stocks. There will be a significant overlap between Guy’s and Pabrai’s portfolios, but Guy’s will have two or three times as many stocks.

Assessment

Dear ME-P Readers, I spoke with your Editor-in-Chief Dr. Dave Marcinko a few weeks ago, and as you can tell from this ME-P essay, I am a very biased book reviewer. I am not even sure this qualifies as a book review. Despite my biases, I can safely say that The Education of a Value Investor is one of the best books I’ve read in 2015. (I promise you that it is not the only book I’ve read this year.) Before you commit your time and money to this book, watch Guy’s presentation on Talks at Google.

ABOUT

Vitaliy N. Katsenelson, CFA, is Chief Investment Officer at Investment Management Associates in Denver, Colo. He is the author of Active Value Investing (Wiley 2007) and The Little Book of Sideways Markets (Wiley, 2010).  His books have been translated into eight languages.  Forbes called him – the new Benjamin Graham.

Conclusion

Your thoughts and comments on this ME-P are appreciated. Feel free to review our top-left column, and top-right sidebar materials, links, URLs and related websites, too. Then, subscribe to the ME-P. It is fast, free and secure.

Speaker: If you need a moderator or speaker for an upcoming event, Dr. David E. Marcinko; MBA – Publisher-in-Chief of the Medical Executive-Post – is available for seminar or speaking engagements. Contact: MarcinkoAdvisors@msn.com

OUR OTHER PRINT BOOKS AND RELATED INFORMATION SOURCES:

***

Comprehensive Financial Planning Strategies for Doctors and Advisors: Best Practices from Leading Consultants and Certified Medical Planners(TM)

***


The third quarter for 2015 was a REAL humdinger!

 Join Our Mailing List
The Markets – Update
Art

By Arthur Chalekian GEPC

[Financial Consultant]

Well, the third quarter for 2015 was a REAL humdinger!
                                            ***
It began with the first International Monetary Fund (IMF) default by a developed country (Greece) and finished with Hurricane Joaquin possibly headed toward the east coast. In between, China’s stock market tumbled, the Federal Reserve tried to interpret conflicting signals, and trade growth slowed globally. After such a stressful quarter, we may see an uptick in the quantity of alcoholic beverages consumed per person around the world. That number had declined (along with economic growth in China) between 2012 and 2014, according to The Economist.
***
No Grexit – for now
Despite defaulting on its IMF loan, rejecting a multi-billion-euro bailout plan, and closing its banks for more than two weeks, Greece was not forced out of the Eurozone. Instead, Europe cooked up a deal that left the IMF unhappy and analysts shaking their heads. The Economist reported the new deal for Greece was an exercise in wishful thinking. The problem is the deal relies on “the same old recipe of austerity and implausible assumptions. The IMF is supposed to be financing part of the bailout. Even it thinks the deal makes no sense.” It’s a recipe we’re familiar with in the United States: When in doubt, defer the problem to the future.
***
A downturn in China
Despite reports from the Chinese government that it hit its economic growth target (7 percent) on the nose during the first two quarters of the year, The Economist was skeptical about the veracity of those claims. During the first quarter.
***
“Growth in industrial production was the weakest since the depths of the financial crisis; the property market, a pillar of the economy, crumbled. China reported real growth (i.e., after accounting for inflation) of 7 percent year-on-year in the first quarter, but nominal growth of just 5.8 percent.”
***
That statistical sleight of hand implies China experienced deflation early in the year. It did not.
On a related note, from mid-June through the end of the third quarter, the Shenzhen Stock Exchange Composite Index fell from 3,140 to about 1,716, according to BloombergBusiness. That’s about a 45 percent decline in value.
***
Red light, green light at the Federal Reserve
Green light: employment numbers. Red light: consumer prices, inflation expectations, wages, and global growth. Late in the quarter, the Federal Reserve decided not to begin tightening monetary policy.
According to Reuters, voting members of the Federal Open Market Committee (FOMC) decided uncertainty in global markets had the potential to negatively affect domestic economic strength. They may have been right. The Wall Street Journal reported, although unemployment remained at 5.1 percent, just 142,000 jobs were added in September. That was significantly below economists’ expectations that 200,000 jobs would be created. The Journal suggested the labor market has downshifted after 18 months of solid jobs creation.
***
Global trade in the doldrums
The global economy isn’t as robust as many expected it to be. According to the Business Standard, the World Trade Organization (WTO) lowered its forecast for global trade growth during 2015 from 3.3 percent to 2.8 percent. Falling demand for imports in developing nations and low commodity prices are translating into less global trade. Expectations are trade growth will be 3.9 percent in 2016, which could help support global economic growth.
***
Coming Change
America’s share of the global economy is potent. Our country accounts for 16 percent (after being adjusted for currency differences) of the world’s gross domestic product (GDP) and 12 percent of merchandise trade.
Again, according to The Economist, we dominate “the brainiest and most complex parts of the global economy.” Our presence is strong in social media, cloud computing, venture capital, and finance. In addition, the dollar is the world’s dominant currency. While the view from the top is pleasing, we may not be there forever. The Economist explained:
***
“In the first change in the world economic order since 1920-45, when America overtook Britain, [America’s] dominance is now being eroded. As a share of world GDP, America and China (including Hong Kong) are neck and neck at 16 percent and 17 percent respectively, measured at purchasing-power parity. At market exchange rates, a fair gap remains with America at 23 percent and China at 14 percent … But any reordering of the world economy’s architecture will not be as fast or decisive as it was last time…the Middle Kingdom is a middle-income country with immature financial markets and without the rule of law. The absence of democracy, too, may be a serious drawback.”
***
It may be hard to believe, in light of recent economic and market events in China, but change is on its way. Regardless, the influence of the United States should continue to be powerful well into the future.

Conclusion

Your thoughts and comments on this ME-P are appreciated. Feel free to review our top-left column, and top-right sidebar materials, links, URLs and related websites, too. Then, subscribe to the ME-P. It is fast, free and secure.

Speaker: If you need a moderator or speaker for an upcoming event, Dr. David E. Marcinko; MBA – Publisher-in-Chief of the Medical Executive-Post – is available for seminar or speaking engagements. Contact: MarcinkoAdvisors@msn.com

OUR OTHER PRINT BOOKS AND RELATED INFORMATION SOURCES:

***

Comprehensive Financial Planning Strategies for Doctors and Advisors: Best Practices from Leading Consultants and Certified Medical Planners(TM)

Front Matter with Foreword by Jason Dyken MD MBA

logos

“BY DOCTORS – FOR DOCTORS – PEER REVIEWED – FIDUCIARY FOCUSED”

***

Eye on the Economy

Join Our Mailing List
The Federal Reserve Resists Change

[By staff reporters]

DJIA: 16,330.47  -179.72  -1.09%

What to watch

The Federal Reserve [FOMC] announced last week that it will leave the federal funds rate unchanged. Unease concerning the domestic implications of international weakness, particularly with regard to inflation, contributed to the Fed’s decision to delay changing its policy right now.

Why it’s important

The Fed’s decision to stay put indicates that policymakers are not as “reasonably confident” that inflation is heading towards their target of 2% as they’d like to be.

For example, Core Inflation [CI], one key economic measure the Fed is watching, is heading into a third year of running below the Fed’s long-run 2% target rate. While the labor market portion of the Fed’s dual mandate appears in good shape, in part indicated by an unemployment rate within their estimate of full employment, policymakers decided to postpone a decision to raise their policy rate for the first time in nearly a decade, citing concerns around the impact that global economic and financial developments could have on domestic conditions.

****

euro

****

Assessment

According to the Vanguard Group, despite the attention given to the timing of when the Fed starts raising rate, some believe the more important questions are how quickly rates will go up and where they stop. Whether liftoff happens in the coming months or even next year, we expect the Fed to make more measured, staggered rate increases than in previous tightening cycles, especially given the fragility in global economic growth.

This “dovish tightening” will gradually normalize policy in a global environment not yet ready for a positive real fed funds rate.

Conclusion

Your thoughts and comments on this ME-P are appreciated. Feel free to review our top-left column, and top-right sidebar materials, links, URLs and related websites, too. Then, subscribe to the ME-P. It is fast, free and secure.

Speaker: If you need a moderator or speaker for an upcoming event, Dr. David E. Marcinko; MBA – Publisher-in-Chief of the Medical Executive-Post – is available for seminar or speaking engagements. Contact: MarcinkoAdvisors@msn.com

OUR OTHER PRINT BOOKS AND RELATED INFORMATION SOURCES:

***

Comprehensive Financial Planning Strategies for Doctors and Advisors: Best Practices from Leading Consultants and Certified Medical Planners(TM)

Front Matter with Foreword by Jason Dyken MD MBA

logos

“BY DOCTORS – FOR DOCTORS – PEER REVIEWED – FIDUCIARY FOCUSED”

***

Practitioners, Prognosticators and Portfolio Pain

Join Our Mailing List

Are recent U.S. equity market highs creating “altitude sickness?

vitaly

By Vitaliy N. Katsenelson CFA

 “Asphyxiation is a condition in which the body doesn’t receive enough oxygen.”

That’s how I started a column a while back, in which I explained how the recent U.S. equity market highs have been creating “altitude sickness,” or value asphyxiation, for investors. If you look down from 30,000 feet, the market is trading at a significant premium to its average long-term valuation, especially if you normalize earnings for sky-high profit margins.

The view from the trenches is not much different. I spend a lot of time looking for new stocks, either by screen or by reading or talking to other value investors. We are all having a hard time finding many stocks of interest. In fact, we’ve been doing a lot more selling than buying.

A Bubble?

I often get asked a question: Are we in a bubble? Bubble is a word that has been thrown around a lot lately. There may be an academic definition of what a bubble is — probably something to do with valuations at least a few standard deviations from the mean — but I don’t really care what it is. (Only academics believe in normal distributions.)

From the practitioner’s perspective, a bubbly valuation occurs when the price-earnings ratio of a company is so high that its earnings will have a hard time growing into investors’ expectations. In other words, the stock is so expensive that investors holding it will find it difficult to realize a positive return for a long time (think of Cisco Systems, Microsoft and Sun Microsystems in 2000). There are some bubbly stocks in the market today. Most years you see some, but today there are probably a few more than usual.

A murky line

We see a lot of overvalued or fully valued stocks. Expectations (valuations) of those stocks have already more than priced in rosy earnings growth scenarios. If these scenarios play out, investors will likely make very little money, as earnings growth will merely offset P/E compression. But, here is where it gets interesting: The line between overvalued and bubbly stocks is often very murky. If the economy’s growth is lower than expected or corporate profit margins revert toward the mean (or, in the situation we have today, decline), the return profiles of these stocks will not be substantially different from those of the bubbly ones. Unfortunately for the value-asphyxiated investor, there are a lot of stocks that fall into this overvalued bucket.

It is very hard for investors to remain disciplined and stick to an investment process. Selling overvalued stocks is hard, because every sell decision brings consequent pain as overvalued stocks that are not aware you’ve sold them keep on marching higher. Just as Pavlov’s dog responded to a bell, the pain of selling teaches us not to sell.

***

free

 ***

More pain

If that pain were not enough, cash keeps burning a hole in our portfolios. Cash doesn’t rise in value when everything else is rising; thus investors feel forced to buy. When you are forced into a buy or sell decision, the outcome will usually not be good. Forced buy decisions are usually bad buy decisions. Just because a stock looks less bad than the rest of the market doesn’t make it a good stock. Maybe its peer is trading at 23 times earnings and your pick is trading at “only” 19. Such relative logic is dangerous today, because it anchors you to a transitory environment that may or may not be there for you in the future (most likely not).

An annoying phase

We are in the most annoying phase of the investing calendar: the month when every market strategist and his dog have to make a prediction as to what the market will do next year. To be right in forecasting, you have to predict often. And market strategists do. In fact, they predict so often that no one remembers how often their predictions worked out. I am not knocking the prognosticators: That is their job. They predict and sound smart doing it — just like it’s the barber’s job to cut your hair and pretend he is concentrating on not cutting off your ear.

It is your job, however, not to pay attention to the predictors. They simply don’t know. They may have a gut feeling, but that feeling is worth as much as you pay for it — very little. To time the market, you have to forecast what the economy will do, which is also very difficult. The Fed has 450 economists working full time on that (half of them are Ph.D.s, but I am not going to hold it against them), and they have an amazingly poor track record. Then you have to figure out how other market participants will respond to the economics news — and that is incredibly difficult. Let’s say you nailed both of these tasks. You still need to predict the multitude of random events — a few of which may be very large black swans — that will show up in the next 12 months. There is a reason why they are called “random.”

Assessment

Though it is dangerous to drink the market’s Kool-Aid and celebrate, it is not time to be gloomy either. There is good news for all of us: Cyclical bull markets are here to absolve us from our “buy” sins. Not every stock in your portfolio is marching in rhythm to its fundamentals. Indeed, this market has lifted many stocks while divorcing them from their weak fundamentals. This absolution is temporary: Take advantage of it. 

ABOUT

Vitaliy N. Katsenelson CFA is Chief Investment Officer at Investment Management Associates in Denver, Colo. He is the author of Active Value Investing (Wiley 2007) and The Little Book of Sideways Markets (Wiley, 2010).  His books were translated into eight languages.  Forbes Magazine called him “The new Benjamin Graham”.  

Conclusion

Your thoughts and comments on this ME-P are appreciated. Feel free to review our top-left column, and top-right sidebar materials, links, URLs and related websites, too. Then, subscribe to the ME-P. It is fast, free and secure.

Speaker: If you need a moderator or speaker for an upcoming event, Dr. David E. Marcinko; MBA – Publisher-in-Chief of the Medical Executive-Post – is available for seminar or speaking engagements. Contact: MarcinkoAdvisors@msn.com

OUR OTHER PRINT BOOKS AND RELATED INFORMATION SOURCES:

***

Comprehensive Financial Planning Strategies for Doctors and Advisors: Best Practices from Leading Consultants and Certified Medical Planners(TM)

Front Matter with Foreword by Jason Dyken MD MBA

logos

“BY DOCTORS – FOR DOCTORS – PEER REVIEWED – FIDUCIARY FOCUSED”

***

Do You Have a “Stomach of Steel” in this Stock Market Environment?

Join Our Mailing List 

The Wall Street Journal Called

Rick Kahler MS CFP

By Rick Kahler CFP® CLU MS http://www.KahlerFinancial.com

[FOMC Holds Steady Today]

A few weeks ago, when the US markets started dropping dramatically, a reporter for The Wall Street Journal called. He asked me if I had received any calls from worried clients. I told him I had heard from 5% of my clients. “What changes in their portfolios are you making?” he asked.

“I’m not making any changes to my investment strategy.”

He expressed amazement that I was not “doing something.” Most investors and their advisors he was speaking with were making “adjustments” to their portfolios. He told me I must have a “stomach of steel.”

Hardly. My gut is certainly not immune to those fearful sinking feelings that go along with market plunges. What I do have is enough experience to trust my long-term investment strategy.

The time most investors and advisors decide an investment strategy doesn’t work is when their portfolios lose value, usually due to a decline in US stocks. This confuses me.

Here’s why:

First, I’m confused that so many investors believe it’s possible to move in and out of markets in such a way that their portfolios will rarely, if ever, suffer a negative return.

This is magical or delusional thinking. The only investor I’m aware of who consistently produced positive returns, year after year, was a fellow by the name of Bernie Madoff. If you have never heard of this investment wizard, he’s the one who is now serving a life sentence in a federal prison for propagating a Ponzi scheme that robbed billions of dollars from investors.

Short-term or moderate-term losses are inevitable in any portfolio that seeks to earn returns above those offered by a bank Certificate of Deposit. Usually, in the long run, markets recover and so does your portfolio.

Sadly, too many investors turn short-term losses into long-term losses by abandoning their investment strategy when the US markets turn down. This locks in their losses, never to be recovered.

If your portfolio is widely diversified among many markets—like bonds, emerging markets, commodities, real estate, TIPs, and various investment strategies—you will almost always have an asset class losing money. You will also almost always have an asset class making money. If not, you probably don’t have a diversified portfolio.

Here’s the second reason I’m confused.

Most investment strategies assume that the US market will decline, and they have a strategy in place for dealing with those declines. For a buy-and-hold investor, the strategy is to do absolutely nothing. For a strategic asset allocator like myself, it’s to rebalance frequently by selling appreciating asset classes and buying into those in decline. By not making changes to clients’ portfolios during a market decline, I am not “doing nothing;” I am simply continuing to follow an investment strategy.

Because most of my clients have learned over time to trust this strategy, relatively few of them make panicky calls to my office during downturns. Yet I have noticed a direct correlation between US stock market declines and my daily phone call volume. Many of the calls are from reporters wanting to know what I am doing and am telling clients. My response—that I’m not doing anything different—is the same thing I told them when the markets last declined in 2011 and before that in 2009, 2008, 2002, 2001, 2000, 1997, etc.

***

untitled

***

Assessment

This isn’t the response an anxious client or a concerned reporter wants to hear. When the emotional center of the brain is overcome with panic and fear, taking action helps relieve anxiety. If that short-term action is selling into volatile stock markets, however, it often turns out to be a long-term mistake.

Conclusion

Your thoughts and comments on this ME-P are appreciated. Feel free to review our top-left column, and top-right sidebar materials, links, URLs and related websites, too. Then, subscribe to the ME-P. It is fast, free and secure.

Speaker: If you need a moderator or speaker for an upcoming event, Dr. David E. Marcinko; MBA – Publisher-in-Chief of the Medical Executive-Post – is available for seminar or speaking engagements. Contact: MarcinkoAdvisors@msn.com

OUR OTHER PRINT BOOKS AND RELATED INFORMATION SOURCES:

Comprehensive Financial Planning Strategies for Doctors and Advisors: Best Practices from Leading Consultants and Certified Medical Planners(TM)

Front Matter with Foreword by Jason Dyken MD MBA

logos

“BY DOCTORS – FOR DOCTORS – PEER REVIEWED – FIDUCIARY FOCUSED”

***

Why There Has To Be Occasional Market Corrections

Join Our Mailing List 

Why Invest … At all!

DJIA plummets 470 today!

By Lon Jefferies CFP MBA lon@networthadvice.com | http://www.networthadvice.com 

Lon JefferiesWhy do we invest in the stock market? To make money so we can improve our standard of living, right?

Notice that we aren’t investing just to get our money back. If we simply wanted our money back, we would place the money in a savings account at a bank where we would likely be able to access it any time and know that we could redeem it at full value.

However, making money is better than simply getting our invested dollars back, so there has to be a trade off for receiving that additional benefit.

Market Corrections

Of course, the trade off is that investing in the market involves more risk than simply depositing money in a bank account. The additional return that is required by investors for investing in an asset that could potentially lose money is called the equity risk premium. There must be a potential downside in exchange for the larger reward that can be obtained by investing in the stock market. Otherwise, no one would ever deposit money into the more secure bank accounts and people would always invest in the stock market generating superior returns. Unfortunately, this would make things too easy, and as we have learned our whole lives, the easier a goal is the less reward we get for achieving that goal. That is why positions that can only be filled by a select few individuals with rare talents (CEOs, doctors, Lebron James) are handsomely compensated.

By now, most people know that over a sufficiently lengthy period of time, the stock market has historically produced returns of approximately 10% per year. This seems like a simple and easy way to make money, so why don’t all investors buy stocks and hold them for extended periods of time? The fact that we aren’t all rich suggests that buying stocks and allowing the market time to do its thing isn’t easy. This is because enduring risk and suffering losses creates negative emotions that get the best of many investors, causing them to sell at the wrong time and stop investing new dollars.

Yet, when we refer back to the concept that the tougher the task the greater the reward, we should be happy that buying and holding stocks isn’t easy because it makes the strategy more profitable.

For this reason, the next time the market goes through a correction or even a crash, wise investors should be grateful. Market volatility causes unsuccessful investors to sell when prices are down and increases the rewards for those who can stick with their investment strategy by holding their assets or even buying new positions.

***

coffee

[Publisher Dr. DE Marcinko’s Grateful Bear Market ReSet and ReLaxation Time]

***

Supply and Demand

Supply and demand suggests that when the markets are decreasing in value, more people are selling assets than buying. The people who are selling their investments at a loss create an equity risk premium for those who can endure market volatility. This increases the reward for successful investors by both providing an opportunity to buy assets when they are inexpensive, and reminding the marketplace that investing in volatile positions is unpleasant. Of course, things that are unpleasant aren’t easy to accomplish, which means there is a large benefit for achieving those things.

Thus, market corrections are great for successful investors because it is volatility and easily-rattled buy-and-sell investors that enable buy-and-hold investors to make significant profits over the long term. In fact, it wouldn’t be possible for stock market investors to make money without periodic intervals of unpleasantness as it is this discomfort which causes some investors to sell and creates an equity risk premium for the rest of us.

***

Japan and world markets tumbling - dollar stronger

[Japanese Markets]

***

Great Fall of China

Until the Great Fall of China recently, it has been easy for investors to buy and hold for the last six years as the market has been nothing but accommodating since early 2009.

However, when things get too easy, it reduces our reward for being a long-term investor because everyone can do it. For this reason, we need the market to experience a correction at some point to shake out the unsuccessful investors, causing them to sell assets and create an equity risk premium once more.

Assessment

When the next correction occurs, you can either sell assets and create a risk premium for others, or you can stay invested and take advantage of the money unsuccessful investors leave on the table. Successful investors with a sufficiently lengthy investment time horizon remind themselves of this concept frequently so that when the market experiences a decline they aren’t overcome by fear but grateful for the opportunity provided by the short-sighted. 

Conclusion

Your thoughts and comments on this ME-P are appreciated. Feel free to review our top-left column, and top-right sidebar materials, links, URLs and related websites, too. Then, subscribe to the ME-P. It is fast, free and secure.

Speaker: If you need a moderator or speaker for an upcoming event, Dr. David E. Marcinko; MBA – Publisher-in-Chief of the Medical Executive-Post – is available for seminar or speaking engagements. Contact: MarcinkoAdvisors@msn.com

OUR OTHER PRINT BOOKS AND RELATED INFORMATION SOURCES:

Sponsors Welcomed: Credible sponsors and like-minded advertisers are always welcomed.

Comprehensive Financial Planning Strategies for Doctors and Advisors: Best Practices from Leading Consultants and Certified Medical Planners(TM)

Front Matter with Foreword by Jason Dyken MD MBA

logos

“BY DOCTORS – FOR DOCTORS – PEER REVIEWED – FIDUCIARY FOCUSED”

Warren Buffet: Fighting Income Inequality with the EITC

Join Our Mailing List

By Prof. Chris House PhD
Ann Arbor Michigan

[Associate Professor of Economics at the University of Michigan]

***

Comprehensive Financial Planning Strategies for Doctors and Advisors: Best Practices from Leading Consultants and Certified Medical Planners(TM)

***

Orderstatistic

Warren Buffet’s article in the Wall Street Journal reminds me of some postsI wrotea while backon fighting income inequality. His article contains a lot of wisdom. Some excerpts:

The poor are most definitely not poor because the rich are rich. Nor are the rich undeserving. Most of them have contributed brilliant innovations or managerial expertise to America’s well-being. We all live far better because of Henry Ford, Steve Jobs, Sam Walton and the like.

He writes that an expansion of the minimum wage to 15 dollars per hour

would almost certainly reduce employment in a major way, crushing many workers possessing only basic skills. Smaller increases, though obviously welcome, will still leave many hardworking Americans mired in poverty. […]  The better answer is a major and carefully crafted expansion of the Earned Income Tax Credit (EITC).

I agree entirely and so would Milton Friedman.

Unlike the…

View original post 212 more words

How [Physician] Investors Should Deal With The Overwhelming Problem Of Understanding The World Economy

Join Our Mailing List

“What the —- do I do now?”

By Vitaliy N. Katsenelson CFA

vitaly This was the actual subject line of an e-mail I received that really summed up most of the correspondence I got in response to an article I published recently. To be fair, I painted a fairly negative macro picture of the world, throwing around a lot of fancy words, like “fragile” and “constrained system.” I guess I finally figured out the three keys to successful storytelling: One, never say more than is necessary; two, leave the audience wanting more; and three … Well, never mind No. 3, but here is more.

Domestic / Global Economy

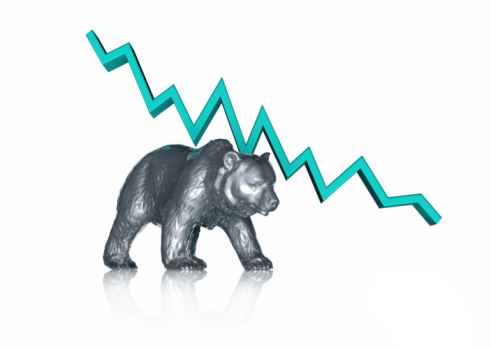
Before I go further, if you believe the global economy is doing great and stocks are cheap, stop reading now; this column is not for you. I promise to write one for you at some point when stocks are cheap and the global economy is breathing well on its own — I just don’t know when that will be. But if you believe that stocks are expensive — even after the recent sell-off — and that a global economic time bomb is ticking because of unprecedented intervention by governments and central banks, then keep reading.

Today, after the stock market has gone straight up for five years, investors are faced with two extremes: Go into cash and wait for the market crash or a correction and then go all in at the bottom, or else ride this bull with both feet in the stirrups, but try to jump off before it rolls over on you, no matter how quickly that happens.

Of course, both options are really nonoptions. Tops and bottoms are only obvious in the rearview mirror. You may feel you can time the market, but I honestly don’t know anyone who has done it more than once and turned it into a process.
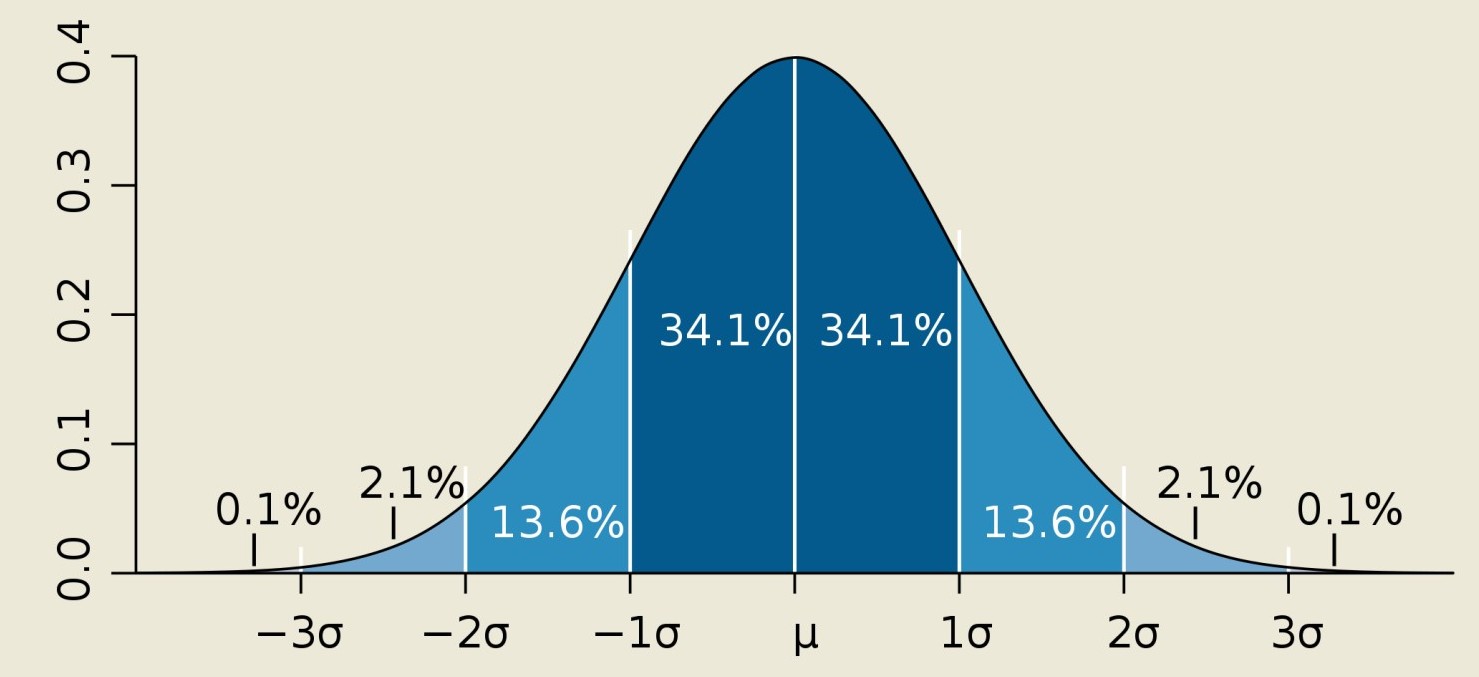
***

sad

[INSANITY]

Psychology

Those little gears spinning but not quite meshing in your so-called mind — will drive you insane. It is incredibly difficult to sit on cash while everyone around you is making money. After all, no one knows how much energy this steroid-maddened bull has left in him. This is not a naturally raised farm animal but a by-product of a Frankenstein-like experiment by the Fed. This cyclical market (note: not secular; short-term, not long-term) may end tomorrow or in five years. Riding this bull is difficult because if you believe the market is overvalued and if you own a lot of overpriced stocks, then you are just hoping that greater fools will keep hopping on the bull, driving stock prices higher. More important, you have to believe that you are smarter than the other fools and will be able to hop off before them (very few manage this). Good luck with that — after all, the one looking for a greater fool will eventually find that fool by looking in the mirror.

As I wrote in an article last spring, “As an investor you want to pay serious attention to ‘climate change’ — significant shifts in the global economy that can impact your portfolio.” There are plenty of climate-changing risks around us — starting with the prospect of higher, maybe even much higher, interest rates — which might be triggered in any number of ways: the Fed withdrawing quantitative easing, the Fed losing control of interest rates and seeing them rise without its permission, Japanese debt blowing up. Then we have the mother of all bubbles: the Chinese overconsumption of natural and financial resources bubble.

Of course, Europe is relatively calm right now, but its structural problems are far from fixed. One way or another, the confluence of these factors will likely lead to slower economic growth and lower stock prices. So “what the —-” is our strategy? Read on to find out. I’ll explain what we’re doing with our portfolio, but first let me tell you a story.

My Story

When I was a sophomore in college, I was taking five or six classes and had a full-time job and a full-time (more like overtime) girlfriend. I was approaching finals, I had to study for lots of tests and turn in assignments, and to make matters worse, I had procrastinated until the last minute. I felt overwhelmed and paralyzed. I whined to my father about my predicament. His answer was simple: Break up my big problems into smaller ones and then figure out how to tackle each of those separately. It worked. I listed every assignment and exam, prioritizing them by due date and importance. Suddenly, my problems, which together looked insurmountable, one by one started to look conquerable. I endured a few sleepless nights, but I turned in every assignment, studied for every test and got decent grades.

[Physician] investors need to break up the seemingly overwhelming problem of understanding the global economy and markets into a series of small ones, and that is exactly what we do with our research. The appreciation or depreciation of any stock (or stock market) can be explained mathematically by two variables: earnings and price-earnings ratio. We take all the financial-climate-changing risks — rising interest rates, Japanese debt, the Chinese bubble, European structural problems — and analyze the impact they have on the Es and P/Es of every stock in our portfolio and any candidate we are considering. Let me walk you through some practical applications of how we tackle climate-changing risks at my firm.

When China eventually blows up, companies that have exposure to hard commodities, directly or indirectly (think Caterpillar), will see their sales, margins and earnings severely impaired. Their P/Es will deflate as well, as the commodity supercycle that started in the early 2000s comes to an end. Countries that export a lot of hard commodities to China will feel the aftershock of the Chinese bubble bursting. The obvious ones are the ABCs: Australia, Brazil and Canada.

However, if China takes oil prices down with it, then Russia and the Middle East petroleum-exporting mono-economies that have little to offer but oil will suffer. Local and foreign banks that have exposure to those countries and companies that derive significant profits from those markets will likely see their earnings pressured. (German automakers that sell lots of cars to China are a good example.) Japan is the most indebted first-world nation, but it borrows at rates that would make you think it was the least indebted country. As this party ends, we’ll probably see skyrocketing interest rates in Japan, a depreciating yen, significant Japanese inflation and, most likely, higher interest rates globally. Japan may end up being a wake-up call for debt investors. The depreciating yen will further stress the Japan-China relationship as it undermines the Chinese low-cost advantage.

So paradoxically, on top of inflation, Japan brings a risk of deflation as well. If you own companies that make trinkets, their earnings will be under assault. Fixed-income investors running from Japanese bonds may find a temporary refuge in U.S. paper (driving our yields lower, at least at first) and in U.S. stocks. But it is hard to look at the future and not bet on significantly higher inflation and rising interest rates down the road.

***

confirmation-bias

[Inflation / Deflation Paradox]

***

A Side Note

Economic instability will likely lead to political instability. We are already seeing some manifestations of this in Russia. Waltzing into Ukraine is Vladimir Putin’s way of redirecting attention from the gradually faltering Russian economy to another shiny object — Ukraine. Just imagine how stable Russia and the Middle East will be if the recent decline in oil prices continues much further. Defense industry stocks may prove to be a good hedge against future global economic weakness. Inflation and higher interest rates are two different risks, but both cause eventual deflation of P/Es. The impact on high-P/E stocks will be the most pronounced.

I am generalizing, but high-P/E growth stocks are trading on expectations of future earnings that are years and years away. Those future earnings brought to the present (discounted) are a lot more valuable in a near-zero interest rate environment than when interest rates are high. Think of high-P/E stocks as long-duration bonds: They get slaughtered when interest rates rise (yes, long-term bonds are not a place to be either). If you are paying for growth, you want to be really sure it comes, because that earnings growth will have to overcome eventual P/E compression. Higher interest rates will have a significant linear impact on stocks that became bond substitutes. High-quality stocks that were bought indiscriminately for their dividend yield will go through substantial P/E compression.

These stocks are purchased today out of desperation. Desperate people are not rational, and the herd mentality runs away with itself. When the herd heads for the exits, you don’t want to be standing in the doorway. Real estate investment trusts (REITs) and master limited partnerships (MLPs) have a double-linear relationship with interest rates: Their P/Es were inflated because of an insatiable thirst for yield, and their earnings were inflated by low borrowing costs. These companies’ balance sheets consume a lot of debt, and though many of them were able to lock in low borrowing costs for a while, they can’t do so forever. Their earnings will be at risk.

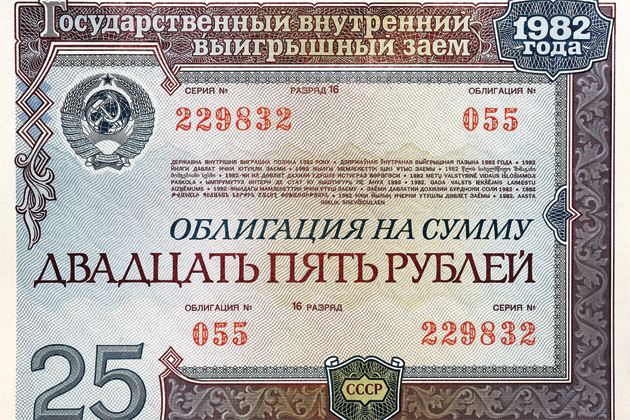
As I write this, I keep thinking about Berkshire Hathaway vice chairman Charlie Munger’s remark at the company’s annual meeting in 2014, commenting on the then-current state of the global economy: “If you’re not confused, you don’t understand things very well.” A year later the state of the world is no clearer. This confusion Munger talked about means that we have very little clarity about the future and that as an investor you should position your portfolio for very different future economies. Inflation? Deflation? Maybe both? Or maybe deflation first and inflation second? I keep coming back to Japan because it is further along in this experiment than the rest of the world.

The Japanese real estate bubble burst, the government leveraged up as the corporate sector deleveraged, interest rates fell to near zero, and the economy stagnated for two decades. Now debt servicing requires a quarter of Japan’s tax receipts, while its interest rates are likely a small fraction of what they are going to be in the future; thus Japan is on the brink of massive inflation. The U.S. could be on a similar trajectory. Let me explain why. Government deleveraging follows one of three paths. The most blatant option is outright default, but because the U.S. borrows in its own currency, that will never happen here. (However, in Europe, where individual countries gave the keys to the printing press to the collective, the answer is less clear.) The second choice, austerity, is destimulating and deflationary to the economy in the short run and is unlikely to happen to any significant degree because cost-cutting will cost politicians their jobs.
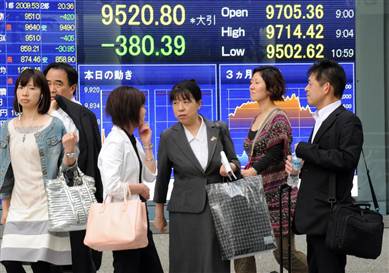
***

Japan and world markets tumbling - dollar stronger

[Nikkei Index]

***

Last, we have the only true weapon government can and will use to deleverage: printing money. Money printing cheapens a currency — in other words, it brings on inflation. In case of either inflation or deflation, you want to own companies that have pricing power — it will protect their earnings. Those companies will be able to pass higher costs to their customers during a time of inflation and maintain their prices during deflation. On the one hand, inflation benefits companies with leveraged balance sheets because they’ll be paying off debt with inflated (cheaper) dollars.

IRs

However, that benefit is offset by the likely higher interest rates these companies will have to pay on newly issued debt. Leverage is extremely dangerous during deflation because debt creates another fixed cost. Costs don’t shrink as fast as nominal revenues, so earnings decline. Therefore, unless your crystal ball is very clear and you have 100 percent certainty that inflation lies ahead, I’d err on the side of owning underleveraged companies rather than ones with significant debt. A lot of growth that happened since 2000 has taken place at the expense of government balance sheets. It is borrowed, unsustainable growth that will have to be repaid through higher interest rates and rising tax rates, which in turn will work as growth decelerators. This will have several consequences:

First, it’s another reason for P/Es to shrink. Second, a lot of companies that are making their forecasts with normal GDP growth as the base for their revenue and earnings projections will likely be disappointed. And last, investors will need to look for companies whose revenues march to their own drummers and are not significantly linked to the health of the global or local economy. The definition of “dogma” by irrefutable Wikipedia is “a principle or set of principles laid down by an authority as incontrovertibly true.” On the surface this is the most dogmatic columns I have ever written, but that was not my intention. I just laid out an analytical framework, a checklist against which we stress test stocks in our portfolio. Despite my speaking ill of MLPs, we own an MLP. But unlike its comrades, it has a sustainable yield north of 10 percent and, more important, very little debt. Even if economic growth slows down or interest rates go up, the stock will still be undervalued — in other words, it has a significant margin of safety even if the future is less pleasant than the present.

There are five final bits of advice I want to leave you

First, step out of your comfort zone and expand your fishing pool to include companies outside the U.S. That will allow you to increase the quality of your portfolio without sacrificing growth characteristics or valuation. It will also provide currency diversification as an added bonus.

Second, disintermediate your buy and sell decisions. The difficulty of investing in an expensive market that is making new highs is that you’ll be selling stocks that hit your price targets. (If you don’t, you should.) Of course, selling stocks comes with a gift — cash. As this gift keeps on giving, your cash balance starts building up and creates pressure to buy. As parents tell their teenage kids, you don’t want to be pressured into decisions. In an overvalued market you don’t want to be pressured to buy; if you do, you’ll be making compromises and end up owning stocks that you’ll eventually regret.

Assessment

Margin of safety, margin of safety, margin of safety — those are my last three bits of advice. In an environment in which the future of Es and P/Es is uncertain, you want to cure some of that uncertainty by demanding an extra margin of safety from stocks in your portfolio.

ABOUT

Vitaliy N. Katsenelson CFA is Chief Investment Officer at Investment Management Associates in Denver, Colo. He is the author of Active Value Investing (Wiley 2007) and The Little Book of Sideways Markets (Wiley, 2010).  His books were translated into eight languages.  Forbes Magazine called him “The new Benjamin Graham”.  

Conclusion

Your thoughts and comments on this ME-P are appreciated. Feel free to review our top-left column, and top-right sidebar materials, links, URLs and related websites, too. Then, subscribe to the ME-P. It is fast, free and secure.

Speaker: If you need a moderator or speaker for an upcoming event, Dr. David E. Marcinko; MBA – Publisher-in-Chief of the Medical Executive-Post – is available for seminar or speaking engagements. Contact: MarcinkoAdvisors@msn.com

OUR OTHER PRINT BOOKS AND RELATED INFORMATION SOURCES:

 Sponsors Welcomed: Credible sponsors and like-minded advertisers are welcomed.

Comprehensive Financial Planning Strategies for Doctors and Advisors: Best Practices from Leading Consultants and Certified Medical Planners(TM)

Front Matter with Foreword by Jason Dyken MD MBA

logos

“BY DOCTORS – FOR DOCTORS – PEER REVIEWED – FIDUCIARY FOCUSED”

Tools for Navigating the Market Pullback

Join Our Mailing List

On Stock market uncertainty?

By Lon Jefferies CFP MBA lon@networthadvice.com | http://www.networthadvice.com 

Lon JefferiesOn August 24th 2015, the Dow Jones Industrial Average opened the day decreasing in value by more than 1,000 points, equating to a -6.42% decline. One of the most volatile days in memory continued, with the DOW fighting back to nearly even by mid-day, down only 98 points or about -0.60%.

Unfortunately, the bounce couldn’t be maintained through the market close with the DOW ending the day down 588 points, off about -3.6%.

How are investors to deal with this level of uncertainty?

First and foremost, remember that this is what diversification is for. It is easy to look at a major market index like the DOW or the S&P 500 and equate the performance of those assets to the performance of your portfolio. However, the first thing investors should remind themselves is that they don’t have a portfolio consisting of only large cap stocks, which is what is measured by both the DOW and S&P 500 index.

In fact, most investors don’t have a portfolio consisting of just stocks. Many investors who are nearing or enjoying retirement may have a portfolio that is closer to only 50% or 60% stocks. If an investor only has 50% of his portfolio invested in stocks, only 50% of the portfolio is invested in the asset that declined in value by -3.6% on August 24th, meaning the individual’s portfolio likely only decreased by about -1.80%. While a -1.80% decline is not pleasant, it is hardly catastrophic.

The next step is to remind ourselves that temporary sharp market declines are common. Morgan Housel, one of my favorite financial writers, noticed that the correction the market is currently experiencing is still not nearly as bad as the correction that took place in the summer of 2011 when the DOW lost 2,000 points in 14 days (a loss of about -15.5%). Mr. Housel points out that no one now remembers or cares about that short-term correction. These market pullbacks will always come and go, and the world will continue to turn.

Additionally, it is useful to acknowledge that while we tend to remember dramatic and shocking market decreases, stocks tends to be an efficient investment over time. Another one of my favorite financial journalists, Ben Carlson, pointed out in his blog that when investors think of the ‘80s the first thing that comes to mind is usually the Crash of ’87 when the Dow lost -22% in one day (Black Monday). However, U.S. stocks were up over 400% during the decade. Similarly, even though stocks are up 200% since March of 2009, many investors have spent the last five years trying to anticipate the next 10% – 20% correction. In retrospect, an investor would have clearly been better off riding the equities rollercoaster during both the good and bad times and ending with a 200% gain rather than being out of the market in an attempt to avoid a small temporary decline. Given a long enough investment time frame, this has always been true and I believe this will continue to be the case.

Finally, as I pointed out in a previous article, it is useful to recall that market corrections are actually a good thing for long-term investors. Fear among investors is what creates the equity risk premium that enables stocks to produce superior investment results when compared to investments with no risk such as CDs and money markets, which essentially experience no growth after accounting for inflation. When investors forget that equities can go both up and down in value, everyone wants to invest their money in stocks. This excess demand inflates asset purchase prices to the point that owning equities is no longer profitable. Market declines reintroduce risk to the investing public, and it is the presence of risk that makes stocks an appreciating asset. Thus, for those who don’t intend to sell their investments for 10+ years, short periods of volatility are a positive because they recreate the equity risk premium which raises rates of return over time.

***

Bear + A Falling Stock Chart

***

Logical steps

These are all logical steps for mentally dealing with market corrections. For those who need it, Josh Brown from CBNC proposes a less logical step for tricking your mind into embracing the market pullback. During scary market environments, Mr. Brown proposes that you identify a couple of stocks you’ve always felt you missed out on. Have you always wished you got in earlier on Apple, Google, Netflix, Chipotle, etc? A market correction like we are experiencing might be the perfect opportunity to become an owner of a great stock at an attractive price. Why not set a number for each of these stocks – say, if they drop in value by 20% – and if those targets are met you commit to buying some shares?

This strategy truly enables you to use lemons to make lemonade. It provides an opportunity to buy shares of companies that you have always wanted without overpaying for them. This mental trick can actually cause you to hope that the market correction continues because you are now hoping for a chance to buy. Rooting for a further correction can certainly make volatile market periods more tolerable.

As I mentioned, this mentality isn’t completely logical because the rest of your portfolio will likely need to decline in value in order to afford you the opportunity to purchase those coveted stocks. However, implementing this strategy is a bit of a mental hedge that enables you to get something good out of whichever direction the market turns. Think of promising yourself a fancy dinner if your favorite sports team loses – of course you don’t want your team to lose, but even if they do you still get something positive out of it.

Assessment

I’m confident that most of my clients already know that selling in the middle of a market correction is not a good idea. Still, I acknowledge that doing nothing as the market seems to be collapsing around you can be nerve-racking – even though it has historically been an appropriate response. Hopefully these mental strategies and tricks enable you to stick to your long-term buy-and-hold investment strategy which has always proved to be profitable given a long enough time frame.

NOTE:

–On a side note, I had zero clients call or email expressing a desire to sell positions yesterday. This enabled everyone to participate in today’s market bounce. Smart clients rule. 

Conclusion

Your thoughts and comments on this ME-P are appreciated. Feel free to review our top-left column, and top-right sidebar materials, links, URLs and related websites, too. Then, subscribe to the ME-P. It is fast, free and secure.

Speaker: If you need a moderator or speaker for an upcoming event, Dr. David E. Marcinko; MBA – Publisher-in-Chief of the Medical Executive-Post – is available for seminar or speaking engagements. Contact: MarcinkoAdvisors@msn.com

OUR OTHER PRINT BOOKS AND RELATED INFORMATION SOURCES:

Sponsors Welcomed: Credible sponsors and like-minded advertisers are always welcomed.

Comprehensive Financial Planning Strategies for Doctors and Advisors: Best Practices from Leading Consultants and Certified Medical Planners(TM)

Front Matter with Foreword by Jason Dyken MD MBA

logos

“BY DOCTORS – FOR DOCTORS – PEER REVIEWED – FIDUCIARY FOCUSED”

Buying Warren Buffett, Richard Branson and Steve Jobs at a Discount

 Join Our Mailing List

On capital allocators with impressive records

vitaly

By Vitaliy Katsenelson CFA

What would you get if you crossed Warren Buffett, Richard Branson and Steve Jobs? Answer: Masayoshi Son, the Korean-Japanese, University of California, Berkeley–educated founder of one of Japan’s most successful companies, SoftBank Corp.

***

interview

[A capital allocator]

***

Masayoshi Son

Just like Buffett, Son is a tremendous capital allocator with a very impressive record: Over the past nine and a half years, SoftBank’s investments have had a 45 percent annualized rate of return. A big chunk of this success can be attributed to one stock: Chinese e-commerce giant Alibaba, a $100 million investment SoftBank made in 2001 that is worth about $80 billion today. Though you may put Alibaba in the (positive) black swan column, Son’s success as an investor goes well beyond it — the list of his investments that have brought multibagger returns is very long. Today, at the tender age of 57, he is the richest man in Japan, and SoftBank, which he started in 1981 and owns 19 percent of, has a market capitalization of $72 billion.

Son, like Apple co-founder Jobs, is blessed with clairvoyance. He saw the Internet as an amazing, transformative force well before that fact became common knowledge. In 1995 he invested in a then-tiny company, Yahoo!, earning six times his investment. But he didn’t stop there; he created a joint venture with Yahoo! by forming Yahoo! Japan, putting about $70 million in a company that today is worth around $8 billion. (Yahoo! Japan is a publicly traded company listed in Japan).

What is shocking is that Son saw that the iPhone would revolutionize the telecom industry before Apple announced it or even invented it. See for yourself in this excerpt from an interview with Charlie Rose, where Son describes his conversation with Jobs in 2005 — two years before the iPhone was introduced:

“I brought my little drawing of [an] iPod with mobile capabilities. I gave [Jobs] my drawing, and Steve says, “Masa, you don’t give me your drawing. I have my own.” I said, “Well, I don’t need to give you my dirty paper, but once you have your product, give me for Japan.” He said, “Well, Masa, you are crazy. We have not talked to anybody, but you came to see me as the first guy. I give to you.”

Richard Branson

Similar to Virgin Group founder Branson, who had the testicular fortitude to create Virgin Atlantic Airways in the U.K. to compete against the state-owned behemoth British Airways, Son started two telecom businesses in Japan — one fixed-line and one wireless — with which he challenged the state-owned NTT monopoly. In 2001, disgusted with Japan’s horrible broadband speeds, he convinced the government to deregulate the telecom industry. When no other companies emerged to compete with NTT (I don’t blame them, really), Son took it upon himself to start a fixed-line competitor, Yahoo! BB (Broadband). Thanks to him, now Japan enjoys one of the highest broadband speeds in the world and Yahoo! BB is a leading fixed-line telecom.

It took Son four years to bring his broadband business to profitability. This is how the Wall Street Journal described that period in 2012:

“The problems at the broadband unit contributed to losses for the entire company for four consecutive years. Mr. Son set up an office in a meeting room 13 floors below his executive suite to be closer to the problem unit. He slept in the office at times and routinely summoned executives and partners for meetings late at night. . . . He worked out of the meeting room for 18 months, until the broadband unit had cut enough costs and moved enough customers to more lucrative plans.”

A normal person might have taken a break and enjoyed the fruits of his labor at that point, but not Son. Just as his broadband business went in the black, Son executed on his vision for the Internet and bought Vodafone K.K., a struggling, poorly run wireless telecom in Japan. SoftBank paid about $15 billion, borrowing $10 billion.

Fast-forward eight years, and SoftBank Mobile is an incredible success. It is one of the largest mobile companies in Japan, even faster growing than NTT Docomo (a subsidiary of almighty NTT). Today it spits out about $5 billion in operating profits annually — not bad for a $5 billion equity investment.

Like Branson, Son is a serial entrepreneur who has started multiple, often unrelated businesses and has succeeded a lot more than he has failed. SoftBank has built a robot named Pepper that can read human emotions; and after the earthquake that crippled Japanese power generation, Son started a renewable-energy business.

Son has a very ambitious goal for SoftBank: He wants it to become one of the largest companies in the world. Unlike the average Wall Street CEO, whose time horizon has shrunk to quarters, Son thinks in centuries. I kid you not — he has a 300-year vision for SoftBank. Practically speaking, 300 years is a bit challenging even for long-term investors, but at the core of his vision Son is building a company that he wants to last forever (or 300 years, whichever comes first).

He views SoftBank as an Internet company and is committed to investing in Internet companies in China and India. He thinks that as these countries develop, their GDPs will eclipse those of the U.S. and Europe.

Jobs, Branson, Buffett — it is very rare for somebody to embody strengths of all three of these giants. None of them has the qualities of the other two. Buffett is not a visionary, nor does he want to run the companies in his portfolio. Branson is not a visionary — in his book Losing My Virginity he admits he did not see analog music (CDs) being destroyed by digital music (iTunes) and demolishing his music store business. Jobs probably came the closest, as both a visionary and a business builder, but he was not known for his investing acumen.

You’d think SoftBank would be richly priced to reflect Son’s premium. Wrong! Today its stock is trading at about a 40 percent discount to the fair value of its known assets (SoftBank has about 1,300 investments, many of them not consolidated on its financials).This discount is not rational, but maybe the market thinks Alibaba is overvalued, or it expects the Japanese yen to continue its decline (I would not disagree), and thus wholly owned Japanese telecom businesses are going to be worth less in U.S. dollars. Or maybe SoftBank’s Sprint investment is not going to work out. Oh, I forgot to mention that one — let’s address it next.

SoftBank’s Japanese telecom businesses generate about $6 billion of very stable operating income, but there is little room for growth in Japan. Unable to find anything telecom to buy in Asia, in 2013 the company took advantage of the strong yen and bought 80 percent of Sprint for $21 billion, or $7.65 a share. Sprint is the No. 3 mobile company in the U.S., a market dominated by AT&T and Verizon, which together account for about 75 percent of wireless revenue and more than 100 percent of wireless profits (T-Mobile and Sprint are losing money). If I knew no more than that, I’d say Sprint’s chances of success in the U.S. are slim — after all, it is competing against two very profitable giants.

But I would have said the same thing about SoftBank’s adventure into fixed-line and then wireless in Japan, and I would have been dead wrong. Admittedly, Sprint’s turnaround will not be easy and will be far from linear, and its $30 billion debt load will not help. SoftBank is looking to apply the tremendous experience it gained through a lot of hard work in turning an ailing Vodafone K.K. into one of the best wireless companies in the world.

However, this time around SoftBank is even better equipped to fight its competition: It has lots of experience with 2.5 GHz spectrum in Japan, where its network is several times faster than Verizon’s and AT&T’s networks in the U.S. SoftBank brought 200 engineers from Japan to help Sprint design its new network; the two companies combined have tremendous buying power in equipment, second only to China Mobile. In fact, suppliers Alcatel-Lucent, Nokia and Samsung just agreed to provide Sprint with $1.8 billion in vendor financing. But most important, SoftBank has already had success with a telecom turnaround. It is following the same road map with Sprint that it used in Japan with Vodafone K.K.: improve the network, cut costs, provide better customer service and top all that with cutthroat price reductions.

***

investmentcenter5

***

Sprint News

Over the past several months, the news flow from Sprint has not been great: It cut guidance, and its stock declined to $4 a share. This may explain why SoftBank’s stock is down; however, even if Sprint meets its maker, the impact on SoftBank should be just $5 a share. Sprint’s $30 billion debt is nonrecourse to SoftBank. Even at current market values, SoftBank’s equity stake in Sprint is worth only $12 billion, while its 32 percent stake in Alibaba is worth $80 billion, and its Japanese telecom businesses are worth about $50 billion (at five times earnings before depreciation and amortization). SoftBank’s stake in Yahoo! Japan is worth north of $8 billion.

Softbank

As part of our investment analysis, we tried to hypothetically kill SoftBank — smother it with a pillow — but we simply could not. We assumed that the yen will depreciate against the dollar to 180 from 120 today, slashing the value of Japanese businesses by a third. Alibaba stock is trading at around $100, about 30 times 2015 earnings forecasts; we took the earnings multiple down to 20 times, pricing the stock at $60. We even assumed SoftBank will have to pay capital gains taxes on selling Alibaba. We halved the price of Sprint’s stock. However, even in this fairly grim scenario we could not get SoftBank’s stock to decline much below its current price of $30. In the worst case we are paying fair value for SoftBank’s assets and get Son’s magic for free. This places no value on his 1,300 other investments, either. Sprint may, by the way, actually work out to be a tremendous success for SoftBank.

There are many ways to look at SoftBank. You can think of it as buying a stock at a roughly 50 percent discount to the market value of its assets or as a way to buy Alibaba at less than half its current price. Alibaba is a great play on China — not the China that builds ghost towns and bridges to nowhere but the Chinese consumer, and not just the Chinese consumer but the Chinese consumer who is spending more and more money shopping online. Alibaba is synonymous with Chinese online shopping, whose growth may accelerate with higher smartphone penetration and, just as important, the ongoing rollout of a fast wireless LTE network.

I’d be remiss if I did not discuss an important asterisk in the ownership of Alibaba. Its shares listed on the NYSE and owned by SoftBank don’t have an economic interest in Alibaba, although, through a stake in a Cayman Islands entity, they have contractual rights to profits from Alibaba China. The latter is owned and controlled by Jack Ma, Alibaba’s founder and CEO. This structure is not a by-product of Ma’s evil intent to steal Alibaba from gullible investors but rather is forced by Chinese law that prohibits foreign ownership in certain industries. There is a risk that the Chinese government might find this structure illegal, but at Alibaba’s size — $240 billion — the company is simply too big to be messed with. China’s economy would pay a huge price if its second-largest public company just disappeared due to a legal technicality. This would also turn into an international public relations nightmare for China, not only with the U.S. but with Japan as well. It would make Ma richer at the expense of U.S. shareholders but also at the expense of SoftBank and Japan’s richest man, Son.

(Those who have a problem with Ma maintaining complete operational control of Alibaba should recall that the phenomenon of founder as benevolent dictator is nothing new — just look at Google. In fact, I’d argue that this control has allowed Ma to sustain his long-term time horizon and this is what has helped Alibaba drive eBay out of China; but that’s a discussion for another time).

Assessment

You can also look at SoftBank as a vehicle through which to invest in emerging markets — not just China but India as well. It is almost like hiring the combination of Buffett, Branson and Jobs to go to work for you investing in markets whose economies in a few decades will surpass that of the U.S., while also investing in a segment of the economy — the Internet — that is growing at a much faster rate than the overall economy. And yes, of course, you have Masayoshi Son, the super-Buffett-Branson-Jobs fusion, making these investments for you. With SoftBank at this valuation, you can forget about your emerging-markets mutual fund.

More: Ode to Steve Jobs

ABOUT

Vitaliy N. Katsenelson, CFA, is Chief Investment Officer at Investment Management Associates in Denver, Colo.

Conclusion

Your thoughts and comments on this ME-P are appreciated. Feel free to review our top-left column, and top-right sidebar materials, links, URLs and related websites, too. Then, subscribe to the ME-P. It is fast, free and secure.

Speaker: If you need a moderator or speaker for an upcoming event, Dr. David E. Marcinko; MBA – Publisher-in-Chief of the Medical Executive-Post – is available for seminar or speaking engagements. Contact: MarcinkoAdvisors@msn.com

OUR OTHER PRINT BOOKS AND RELATED INFORMATION SOURCES:

Comprehensive Financial Planning Strategies for Doctors and Advisors: Best Practices from Leading Consultants and Certified Medical Planners(TM)

Front Matter with Foreword by Jason Dyken MD MBA

logos

“BY DOCTORS – FOR DOCTORS – PEER REVIEWED – FIDUCIARY FOCUSED”

***

Understanding International Bond Advantages?

Join Our Mailing List

In Global Investable Markets

tim[By Timothy J. McIntosh MBA CFP® MPH]

International bonds now account for more than 35% of the world’s investable assets, and yet many physicians and other investors have little or no exposure to these types of securities. International fixed income securities make up a noteworthy portion of the global investable market.

While investors in international bonds are exposed to the hazard of interest rate movements and political risks, the principal factors driving international bond prices are actually uncorrelated to the most common U.S. risk factors. This indicates a true diversification benefit for any investor. International bonds have become more prominent and attractive due to the increase in globalization and the pervasive expansion of debt issuance overseas, primarily by governments. There has been a near doubling of the relative weight of the non-U.S. bond market from approximately 19% in 2000 to approximately 37% in 2011.  Thus, there is more selection of international bonds than ever for U.S. investors.

***

shaking-hands

[Global Debt Markets]

***

Investing in international bonds involves contact to the movements of global currencies. This is the primary component of determining international bond returns.  Alternations in currencies create an extra layer of volatility in these types of securities.

However, that volatility actually enhances diversification benefits.  One of the key considerations of any purchase of international bonds is whether or not to hedge the currency impact.  These deviations create return volatility above the level inherent to the underlying investment. An allocation to an unhedged international bond does reflect an investor’s bearish view of the U.S. dollar.  This is because as the dollar depreciates against a foreign currency, an international bond will gain in value.  The last 25-plus years have witnessed a long-term decline in the U.S. dollar, actually providing a tail wind for international bond investors.

***

russian bonds

[Russian Bond]

***

In fact, according to data from Vanguard, unhedged international bonds outperformed hedged bonds by 2.2 percentage points a year since 1987. The diversification benefit from international bonds is also attractive.

For example, from January 1, 1992 to March 31, 2013, the correlation between the Citigroup World Government Bond Index ex-US 1-3 Years index and five-year U.S. Treasury notes was a mere 0.35.  An allocation to international bonds can amplify portfolio diversification across economies, currencies, and yield curves.

***

IMG_0737

[iMBA Inc., in Moscow]

***

More:

Conclusion

Your thoughts and comments on this ME-P are appreciated. Feel free to review our top-left column, and top-right sidebar materials, links, URLs and related websites, too. Then, subscribe to the ME-P. It is fast, free and secure.

ABOUT

Timothy J. McIntosh is Chief Investment Officer and founder of SIPCO.  As chairman of the firm’s investment committee, he oversees all aspects of major client accounts and serves as lead portfolio manager for the firm’s equity and bond portfolios. Mr. McIntosh was a Professor of Finance at Eckerd College from 1998 to 2008. He is the author of The Bear Market Survival Guide and the The Sector Strategist.  He is featured in publications like the Wall Street Journal, New York Times, USA Today, Investment Advisor, Fortune, MD News, Tampa Doctor’s Life, and The St. Petersburg Times.  He has been recognized as a Five Star Wealth Manager in Texas Monthly magazine; and continuously named as Medical Economics’ “Best Financial Advisors for Physicians since 2004.  And, he is a contributor to SeekingAlpha.com., a premier website of investment opinion. Mr. McIntosh earned a Bachelor of Science Degree in Economics from Florida State University; Master of Business Administration (M.B.A) degree from the University of Sarasota; Master of Public Health Degree (M.P.H) from the University of South Florida and is a CERTIFIED FINANCIAL PLANNER® practitioner. His previous experience includes employment with Blue Cross/Blue Shield of Florida, Enterprise Leasing Company, and the United States Army Military Intelligence.

Speaker: If you need a moderator or speaker for an upcoming event, Dr. David E. Marcinko; MBA – Publisher-in-Chief of the Medical Executive-Post – is available for seminar or speaking engagements. Contact: MarcinkoAdvisors@msn.com

OUR OTHER PRINT BOOKS AND RELATED INFORMATION SOURCES:

Comprehensive Financial Planning Strategies for Doctors and Advisors: Best Practices from Leading Consultants and Certified Medical Planners(TM)

“Physicians who don’t understand modern risk management, insurance, business and asset protection principles are sitting ducks waiting to be taken advantage of by unscrupulous insurance agents and financial advisors; and even their own prospective employers or partners.

This comprehensive volume from Dr. David Marcinko, and his co-authors, will go a long way toward educating physicians on these critical subjects that were never taught in medical school or residency training.”

Dr. James M. Dahle MD FACEP

[Editor of The White Coat Investor, Salt Lake City, Utah, USA]

http://www.CertifiedMedicalPlanner.org

***

Some Prognostications On Government Bond Yields?

Join Our Mailing List

Gazing into the Future … Always Dangerous!

tim[By Timothy J. McIntosh MBA CFP® MPH]

Given that government bond yields today are at historical lows, the opportunity for price appreciation is minimal. More likely, the collection of interest payments will provide most, if not all, of market returns.

Additionally, interest rates could also trend up over the ensuing decade.  This would result in capital losses as bond prices decline, reducing total return further.  Much like the decade of the 1940s, total returns from bonds will most likely be subdued as either market interest rates remain constant or interest rates trend upwards.

Most certainly, physicians and all investors, cannot expect an average long term return of 5.40%.  A 3% total return over the ensuing decade is most probable.  The problem with this examination is that most individual investors have a substantial portion of their assets in bonds, especially of the government sort.  As the average total portfolio return target for most investors is 6-8% on an annualized basis, investors must expect either a substantial decline in interest rates from the current historic lows, or that stocks will make up the difference.

***

Portrait of two surgeons in a operating theatre

***

Although bonds do present moderate investments returns for today’s investor, without bonds as part of a portfolio, investment losses could be a much higher percentage if invested in stocks alone.  But, stocks do generate a higher rate of return over a long period, in short or immediate term, they may well be outperformed by bonds, especially at critical periods in the economic cycle. Bonds in general are known for the stability and predictability of returns. Bonds, especially those of the government kind, have a low standard deviation (volatility).

In fact, bonds are one of the least risky asset classes an investor can own.  When combining bonds in a diversified portfolio, you will lower your overall risk.  The tradeoff, of course, is the return will be lower than an all stock portfolio.

Most investors have money parked in bonds of the government type, i.e. notes, bills, or bonds.  The reason for this has to do with risk and diversification.  Government bonds have one of the lowest risk profiles of any asset class, and have generally produced consistent returns.  Government bonds are also thought to maintain a very low correlation (a statistical measure of how two securities move in relation to each other) with equities.  The long-term average correlation is about 0.09.

***

Bonds

***

However, this verity has to be examined on a long-term framework.  In fact, correlations between U.S. stocks and treasury bonds have swung widely over the past eighty years. The correlation was positive for most of the late 1930s and throughout the 1940s.  In the 1950s, the correlation was actually negative as stocks advanced strongly and bonds suffered from declining prices (due to increasing interest rates).  From the mid-1960s until 2000 there was a positive correlation, averaging about 0.50.  The correlation turned negative once gain during the past decade.

This was primarily due to the fact that stocks struggled mightily with two large bear market declines (2002, 2008), while bonds rallied strongly as interest rates declined.  So much of the supposed low or negative correlation depends upon what time period you examine. The principal problem with owning government bonds is the negative correlation an investor is looking for only appears sporadically throughout history.

Assessment

There are a number of risk variables to consider when investing in bonds as they may affect the value of the bond investment over time. These variables include changes in interest rates, income payments, bond maturity, redemption features, credit quality, priority in capital structure, price, yield, tax status and other provisions.

ABOUT

Timothy J. McIntosh is Chief Investment Officer and founder of SIPCO.  As chairman of the firm’s investment committee, he oversees all aspects of major client accounts and serves as lead portfolio manager for the firm’s equity and bond portfolios. Mr. McIntosh was a Professor of Finance at Eckerd College from 1998 to 2008. He is the author of The Bear Market Survival Guide and the The Sector Strategist.  He is featured in publications like the Wall Street Journal, New York Times, USA Today, Investment Advisor, Fortune, MD News, Tampa Doctor’s Life, and The St. Petersburg Times.  He has been recognized as a Five Star Wealth Manager in Texas Monthly magazine; and continuously named as Medical Economics’ “Best Financial Advisors for Physicians since 2004.  And, he is a contributor to SeekingAlpha.com., a premier website of investment opinion. Mr. McIntosh earned a Bachelor of Science Degree in Economics from Florida State University; Master of Business Administration (M.B.A) degree from the University of Sarasota; Master of Public Health Degree (M.P.H) from the University of South Florida and is a CERTIFIED FINANCIAL PLANNER® practitioner. His previous experience includes employment with Blue Cross/Blue Shield of Florida, Enterprise Leasing Company, and the United States Army Military Intelligence.

Conclusion

Your thoughts and comments on this ME-P are appreciated. Feel free to review our top-left column, and top-right sidebar materials, links, URLs and related websites, too. Then, subscribe to the ME-P. It is fast, free and secure.

Speaker: If you need a moderator or speaker for an upcoming event, Dr. David E. Marcinko; MBA – Publisher-in-Chief of the Medical Executive-Post – is available for seminar or speaking engagements. Contact: MarcinkoAdvisors@msn.com

OUR OTHER PRINT BOOKS AND RELATED INFORMATION SOURCES:

Comprehensive Financial Planning Strategies for Doctors and Advisors: Best Practices from Leading Consultants and Certified Medical Planners(TM)

“Physicians who don’t understand modern risk management, insurance, business and asset protection principles are sitting ducks waiting to be taken advantage of by unscrupulous insurance agents and financial advisors; and even their own prospective employers or partners.

This comprehensive volume from Dr. David Marcinko, and his co-authors, will go a long way toward educating physicians on these critical subjects that were never taught in medical school or residency training.”

Dr. James M. Dahle MD FACEP

[Editor of The White Coat Investor, Salt Lake City, Utah, USA]

http://www.CertifiedMedicalPlanner.org

Using Deposits and Withdrawals to Rebalance Your Portfolio

Join Our Mailing List 

Benefits of portfolio rebalancing well documented

[By Lon Jefferies MBA CFP®] http://www.NetWorthAdvice.com

Lon JefferiesThe benefits of rebalancing a portfolio are well documented. Constant and routine rebalancing forces a physician or any investor to lighten the portfolio positions that have recently performed well and use the resulting funds to buy more shares of the assets in the portfolio that have remained flat or even declined in value. In other words, rebalancing causes the investor to sell high and buy low.

Most financial professionals recommend rebalancing your portfolio at least once a year (I rebalance my clients’ portfolios on a semi-annual basis).

However, the tax status of an investment account can have a significant impact on a rebalancing strategy. While investments within a tax-advantaged account like a traditional or Roth IRA can be sold without tax implications, selling appreciated assets in a taxable investment accounts will create a capital gains liability.

Consequently, while rebalancing within a tax-advantaged account should be a no-brainer, investors should carefully consider the tax implications that may result from rebalancing a normal investment account.

***

prt_320x212_1397595292

[Routine Portfolio Rebalancing]

***

For this reason, investors should view every deposit to or withdrawal from a taxable investment account as a chance to rebalance. Depositing new money is a free opportunity to buy more of the positions in which the portfolio is underweight.

Example:

For example, suppose an investment account of $100,000 has a target asset allocation of 50% stocks and 50% bonds ($50,000 invested in both). After a year in which stocks made 10% and bonds were flat, the portfolio would consist of $55,000 of stocks and $50,000 of bonds, for a total account balance of $105,000. If at this point the investor would like to invest an additional $5,000, the entire contribution should be placed in bonds, bringing the actual portfolio allocation back to 50% stocks and 50% bonds ($55,000 in each).

Of course, this same strategy can be implemented regardless of the size of the additional contribution. If the investor wanted to contribute $10,000 in year two, the total account value would be $115,000 ($105k current balance + $10k new money). In order to get back to our 50% stock and 50% bond targets, we would want $57,500 in each position. With $55,000 already invested in stocks, we would only want to invest $2,500 of the new money into stocks and place the remaining $7,500 into bonds, bringing both portions of the portfolio up to their targets.

Taking withdrawals from a taxable investment account should also be viewed as an opportunity to rebalance. Rebalancing via withdrawals may not be free as it is when rebalancing is done when new funds are deposited because appreciated assets are likely sold, creating a tax liability. However, when a withdrawal is taken from a taxable account, it is still wise to sell overweight asset categories to produce the funds needed for the distribution.

Example:

Let’s return to our previous example of a 50% stock and 50% bond target portfolio that had grown to $55,000 of stock and $50,000 of bonds. If the investor then wanted to withdraw $10,000, he could take the entire distribution out of bonds which would allow him to free up the amount needed without creating a tax liability. However, the resulting portfolio would consist of $55,000 of stocks and $40,000 of bonds – a ratio of approximately 58% stocks and 42% bonds.

This is a significantly more volatile portfolio than the target 50% / 50% portfolio. For example, in 2008 a portfolio that consisted of 50% large cap stocks and 50% long term government bonds lost -7.16%. Meanwhile, a portfolio of 58% stocks and 42% bonds lost -11.93% over the same period – a 66.6% increase in volatility.

Alternatively, I’d suggest using the $10,000 withdrawal to rebalance the portfolio, bringing the resulting $95,000 portfolio back to 50% stocks and 50% bonds ($47,500 in each). Of course, to do this, the investor would liquidate $7,500 of stocks and $2,500 of bonds. Although this could potentially create a small capital gains tax liability, this is a tax bill that will need to be paid at some point anyhow, and the investor will maintain a portfolio with the target amount of volatility.

Further, remember that the long-term capital gains rate (which applies to any capital assets held for over a year) is a favorable tax rate. For single filers with a taxable income of less than $37,450 and joint filers with a taxable income of less than $74,900, the capital gains tax rate is actually 0%!

Additionally, for single filers with a taxable income of between $37,450 and $406,750 and joint filers with a taxable income of between $74,900 and $457,600, the capital gains tax rate is only 15%. Consequently, the investor can likely rebalance the portfolio back to the target allocation via the withdrawal while incurring only a nominal tax bill.

***

healthfinance

***

Assessment

While rebalancing provides a significant increase in investment return over long time periods, tax implications should be considered when determining whether or not to rebalance a taxable investment account. However, depositing money to or withdrawing money from these accounts provides a favorable opportunity to obtain the return premium rebalancing creates while minimizing tax implications.

Conclusion

Your thoughts and comments on this ME-P are appreciated. Feel free to review our top-left column, and top-right sidebar materials, links, URLs and related websites, too. Then, subscribe to the ME-P. It is fast, free and secure.

Speaker: If you need a moderator or speaker for an upcoming event, Dr. David E. Marcinko; MBA – Publisher-in-Chief of the Medical Executive-Post – is available for seminar or speaking engagements. Contact: MarcinkoAdvisors@msn.com

OUR OTHER PRINT BOOKS AND RELATED INFORMATION SOURCES:

Risk Management, Liability Insurance, and Asset Protection Strategies for Doctors and Advisors: Best Practices from Leading Consultants and Certified Medical Planners™8Comprehensive Financial Planning Strategies for Doctors and Advisors: Best Practices from Leading Consultants and Certified Medical Planners™

Physicians are notoriously excellent at diagnosing and treating medical conditions. However, they are also notoriously deficient in managing the business aspects of their medical practices. Most will earn $20-30 million in their medical lifetime, but few know how to create wealth for themselves and their families. This book will help fill the void in physicians’ financial education. I have two recommendations: 1) every physician, young and old, should read this book; and 2) read it a second time!

Dr. Neil Baum MD [Clinical Associate Professor of Urology, Tulane Medical School, New Orleans, Louisiana]

http://www.CertifiedMedicalPlanner.org

Enter the CMPs

Doctors Going Granular on Investment Risk

Join Our Mailing List 

It is Not What You Think!

[By Lon Jefferies MBA CMP® CFP®]

Lon JefferiesA new logic has been surfacing amongst the top minds in the financial planning industry.

Many of my favorite financial authors – Warren Buffett, Josh Brown, Nick Murray, Howard Marks, and others – have proposed the need to redefine the word “risk.”

Risk” vs “Volatility”

Most investors and financial advisors tend to utilize the words “risk” and “volatility” interchangeably. We measure how risky a portfolio is by examining its potential downside performance.

For example, we review how much a similar portfolio lost during 2008 or when the tech bubble popped in 2000-2002. When doing this, we are really talking about volatility rather than risk. Volatility – usually measured by standard deviation – reflects how much a portfolio is likely to increase or decrease in value when the market as a whole fluctuates. Risk, however, is quite different.

Two Threats

Josh Brown characterizes risk as the possibility of two threats:

  1. The possibility of not having enough money to fund a specific goal, which includes the possibility of outliving your money
  2. The possibility of a permanent loss of capital.

Example:

In a dramatic example of how volatility is different from risk, consider a retiree with a $10 million portfolio who only spends $50,000 a year. Next, assume the investor experiences a two-year period in which during the first year his portfolio loses 50% of its value and in year two the portfolio earns a 100% return. Thus, after year one the portfolio would only be worth $5 million and after year two it would again be worth $10 million.

Clearly, this is a very volatile portfolio that is subject to a wide range of potential performance outcomes. However, is this portfolio truly risky to the investor? According to Mr. Brown’s first factor, the portfolio is not risky because the investor will have enough money to fund his $50k per year retirement regardless of whether his portfolio is valued at $10 million or $5 million. Additionally, the portfolio is also not risky according to the second factor in that the investor didn’t experience a permanent loss.

Investors tend to view stocks as risky assets because their returns have a large standard deviation (variation from a mean). Similarly, we tend to view money market equivalents such as CDs and savings accounts as very safe investments because their returns have less dispersion, and consequently, are more predictable.

However, rather than considering stocks to be risky and cash equivalents to be safe, it would be more accurate to consider stocks an investment with high volatility and cash to be a holding with low volatility.

***

hacker

***

What is the difference?

Suppose it is determined that you need an average rate of return of 6% over time to achieve your retirement goals. Historically, over a sufficiently significant period of time, stocks have returned an average of about 10% per year while cash equivalents have returned about 3% per year. Consequently, if these averages continue in the future, you actually have a very low chance of reaching your retirement goal of not outliving your money if you place money in the “safe” investment of a cash equivalent, while you would actually have a high probability of reaching your retirement goal if you place money in a more volatile basket of stocks.

By this metric, cash is actually the more risky investment because investing in it would increase the probability of outliving your funds. Meanwhile a basket of stocks, if given enough time to achieve its historically average rate of return, is actually the safer investment as it gives you a higher probability of not outliving your nest egg.  Thus, while a portfolio of stocks will almost certainly experience more short-term volatility, over an extended period of time it very well may be a safer investment for ensuring your retirement goals are met.

Further, Mr. Brown proposes that the muddying of definition between risk and volatility is something a portion of the financial service industry has done on purpose. Brown suggests that the easiest way to sell someone a product is to first convince them they have a need. If hedge fund managers, insurance agents, and annuity salesmen can make consumers believe that volatility is equal to risk, and that since their products minimize volatility they must also minimize risk, they can achieve more sales.

However, even if an annuity can eliminate downside volatility, if it limits potential return to an amount that is insufficient to achieve the investor’s long-term goals, the investment is still more risky than an investment with more short-term volatility but a higher probability of long-term success.

***

Bell Curve

***

Assessment

Next time the market goes through a correction, remember that the drop in your portfolio’s value is a reflection of the potential volatility your portfolio is capable of experiencing. Yet, recall that as long as you don’t sell your assets and suffer a permanent loss of your investment capital, you can allow the market time to recover and achieve its historical rate of return.

Doing so will ultimately make your investment strategy less risky than utilizing investment options that experience less volatility because it maximizes the probability you will eventually achieve your long-term financial goals.

More:

Conclusion

Your thoughts and comments on this ME-P are appreciated. Feel free to review our top-left column, and top-right sidebar materials, links, URLs and related websites, too. Then, subscribe to the ME-P. It is fast, free and secure.

Speaker: If you need a moderator or speaker for an upcoming event, Dr. David E. Marcinko; MBA – Publisher-in-Chief of the Medical Executive-Post – is available for seminar or speaking engagements. Contact: MarcinkoAdvisors@msn.com

OUR OTHER PRINT BOOKS AND RELATED INFORMATION SOURCES:

Risk Management, Liability Insurance, and Asset Protection Strategies for Doctors and Advisors: Best Practices from Leading Consultants and Certified Medical Planners™8Comprehensive Financial Planning Strategies for Doctors and Advisors: Best Practices from Leading Consultants and Certified Medical Planners™

This book was crafted in response to the frustration felt by doctors who dealt with top financial, brokerage, and accounting firms. These non-fiduciary behemoths often prescribed costly wholesale solutions that were applicable to all, but customized for few, despite ever-changing needs. It is a must-read to learn why brokerage sales pitches or Internet resources will never replace the knowledge and deep advice of a physician-focused financial advisor, medical consultant, or collegial Certified Medical Planner™ financial professional.

Parin Khotari MBA [Whitman School of Management, Syracuse University, New York]

http://www.CertifiedMedicalPlanner.org

Enter the CMPs

Finding Value in an Overpriced Stock Market

Join Our Mailing List

Behind the Ugly Red Door

vitalyBy Vitaliy Katsenelson CFA

I am about to write a quarterly letter to clients, telling them that despite all the giddiness in the stock market, we are in Value Investor Second Hell. This is not the first hell; that one is reserved for value traps — stocks that look cheap based on past earnings but whose earnings are about to disappear, whereupon the stocks will permanently decline.

***

The second hell is when you cannot find value. I recently read a study that said the difference in valuation between the cheapest stocks (the lowest 10 percent of the market) and the rest of the market is the smallest it has been in more than 20 years. Of course, the market overall is very pricey; finding undervalued stocks in this environment has become increasingly difficult.

***

To adapt, you need to understand that there are two types of value stocks. The first are statistically cheap — their cheapness stares you in the face. This breed is quickly becoming scarce; even Hewlett-Packard Co. and Xerox Corp. are now found in growth investors’ portfolios. But before I talk about the second type of value stocks, let me tell you how my wife and I bought our house.

***

statistics

***

It was 2005. The housing market in Denver, just as in the rest of the U.S., was getting bubbly. Our family was about to grow, though we did not know it yet. We had sold our condo and were renting month to month and thus were under no pressure to buy a house, but we were keeping our eyes peeled for the right one at the right price. It was a nine-month journey. We even made some offers (usually below the asking price), which the sellers laughed at. They were right; their houses sold above the asking prices in just a few days.

***

I vividly remember how we finally found our house — and I have to admit it was entirely my wife’s doing. We were flipping through photos of house listings that met our criteria. We stumbled on a picture of an ugly green house with a bright red garage door, which had been on the market for six months. I made a snarky comment that this house would be on the market for another six months and was about to click to the next, but my supersmart wife said, “Wait.” She skipped all the pictures of the ugly outside and zeroed in on the photos of the interior of the house.

***

To my great surprise, this ugly duckling was ugly only on the exterior and had been completely redesigned inside. It was a perfect house for us. Since it had been on the market for a long time, the seller was willing to accept our low offer. I, like everyone else who did not buy this house for six months, was turned off by an ugly outside (which could be easily corrected with some paint) and failed to look deeper.

***

Back to the stock market. The other breed of value stocks are the ones with “ugly green paint jobs and bright red garage doors,” the ones that look unappealing from the outside and aren’t even cheap, at least not according to the statistics at everyone’s fingertips. Often, backward-looking statistics don’t capture such companies’ true earnings power, as it has yet to show itself. These are the stocks you should patiently seek out, especially in today’s value-deprived environment.

***

circuit

***

A stock that comes to mind is Micron Technology, a maker of memory chips. Micron has destroyed more capital over the years than Communism and Socialism combined. To be fair, it was not Micron’s fault: Its profitability — or lack thereof — was determined by its industry. Micron was a large player in a very fragmented business that Asian governments thought was strategic to the development of their countries, and so they subsidized their local companies. The memory industry was ridden with overcapacity. But nothing transforms an industry better than a financial crisis. The 2008–’09 global recession weeded out the weak players, and Micron bought the last one, Elpida Memory, in 2013 on the cheap, almost doubling its revenues.

***

Now the DRAM industry has only three players: Micron, Samsung and SK Hynix (a South Korean version of Micron). NAND memory (used in flash and solid-state drives) has the same competitors plus SanDisk Corp. Barriers to entry are enormous — a new entrant would have to spend billions of dollars on R&D and then tens of billions on factories. Therefore this cozy, oligopolylike industry structure is unlikely to change. Samsung, the largest player in the space, has an extra incentive to keep chip prices high because they give it a competitive advantage against Apple and, more important, against low-end Chinese smartphone makers that have to buy memory at market prices.

***

Gross margins of all memory companies have been gradually rising and still have significant room to grow. If Micron achieves its target margin level, in the mid to high 40s, its earnings will hit $4 to $6 per share in a few years, giving it a modest price-earnings ratio of 4 to 5 times. This is one cheap “ugly green paint job, bright red garage door” stock.

***

ABOUT
Vitaliy N. Katsenelson, CFA, is Chief Investment Officer at Investment Management Associates in Denver, Colo.
 

Conclusion

Your thoughts and comments on this ME-P are appreciated. Feel free to review our top-left column, and top-right sidebar materials, links, URLs and related websites, too. Then, subscribe to the ME-P. It is fast, free and secure.

Speaker: If you need a moderator or speaker for an upcoming event, Dr. David E. Marcinko; MBA – Publisher-in-Chief of the Medical Executive-Post – is available for seminar or speaking engagements. Contact: MarcinkoAdvisors@msn.com

OUR OTHER PRINT BOOKS AND RELATED INFORMATION SOURCES:

Risk Management, Liability Insurance, and Asset Protection Strategies for Doctors and Advisors: Best Practices from Leading Consultants and Certified Medical Planners™8Comprehensive Financial Planning Strategies for Doctors and Advisors: Best Practices from Leading Consultants and Certified Medical Planners™

I have read these texts and used consulting services from the Institute of Medical Business of Advisors, Inc., on several occasions. 

MARSHA LEE; DO [Radiologist, Norcross, GA]

The “White Coat Investor” PodCast

Join Our Mailing List

By Dr. James Dahle MD – White Coat Investor

Jim Dahl md

Dr. James Dahle, editor of www.whitecoatinvestor.com and the rising star of physician financial advice and straight talk about success was kind enough to share his time and expertise with us and talked to us about:

  • What got him so interested in getting a financial education and why he shares that knowledge with other docs
  • How med students can minimize student loan debt and why that is so important
  • Insurance and why it is imperative that you have the right kind
  • The importance of creating profitable habits for your success

***

statistics

Click here to listen to this episode

***

Assessment

His new book is The White Coat Investor: A Doctor’s Guide to Personal Finance and Investing.

Conclusion

Your thoughts and comments on this ME-P are appreciated. Feel free to review our top-left column, and top-right sidebar materials, links, URLs and related websites, too. Then, subscribe to the ME-P. It is fast, free and secure.

Speaker: If you need a moderator or speaker for an upcoming event, Dr. David E. Marcinko; MBA – Publisher-in-Chief of the Medical Executive-Post – is available for seminar or speaking engagements. Contact: MarcinkoAdvisors@msn.com

OUR OTHER PRINT BOOKS AND RELATED INFORMATION SOURCES:

Comprehensive Financial Planning Strategies for Doctors and Advisors: Best Practices from Leading Consultants and Certified Medical Planners™

 Risk Management, Liability Insurance, and Asset Protection Strategies for Doctors and Advisors: Best Practices from Leading Consultants and Certified Medical Planners™

Physicians who don’t understand modern risk management, insurance, business and asset protection principles are sitting ducks waiting to be taken advantage of by unscrupulous insurance agents and financial advisors; and even their own prospective employers or partners. This comprehensive volume from Dr. David Marcinko, and his co-authors, will go a long way toward educating physicians on these critical subjects that were never taught in medical school or residency training.

JAMES M. DAHLE; MD, FACEP

What If the Stock Market Falls 30%?

Join Our Mailing List

Are YOU ready, Doctor?

By Michael Zhuang,

[Principal of MZ Capital Management – Contributor to Morningstar and Physicians Practice]

Ever since it touched bottom on March 9th, 2009, the market has been going up and up and up with barely any hiccup. That’s dangerous! Because our minds could get complacent. That’s why I want to do a mental exercise with all of you: What would you do if the market falls 30%?

First of all, recognize these two important facts:

1.    Market fall of 30% and above happened every ten years or so.

If we use history as a guide, we should expect a 10% odds of that happening over the next 12 months. (So don’t be surprised.)

2.    All market tumbles of that magnitude were recovered within 18 months in the US. (So don’t despair.)

So instead of seeing a 30% fall a bad thing: a horrible hit to your wealth, how about seeing that as a good thing: a deep discount of productive assets on sale that happens only once every decade.

Here is what you should do before, during and after a 30% fall of the market.

1.    Start with having an appropriate asset allocation. Depending on your age and risk tolerance, maybe it’s a 70/30 portfolio, or a 60/40 one, or a 50/50 one.

2.    Stick to it through good market and bad.

3.    Rebalance periodically or opportunistically

Let’s take a 50/50 portfolio for example. After the (stock) market tumble of 30%, the portfolio becomes 35/65. To rebalance back to 50/50, you must sell appreciated bonds and buy discounted stocks.

When you do the above over and over, you create a system of buying low and selling high.

An additional note on rebalance, to keep it simple, you can rebalance every year. The optimal rebalance however, is opportunistic not periodic. The research on that was published in Journal of Financial Analyst and it suggests a rebalance when an asset class has deviated from its target allocation by 20%. When this is done right, you can add about 40 basis points in excess return.

***

stock market

***

Channel Surfing

Have you visited our other topic channels? Established to facilitate idea exchange and link our community together, the value of these topics is dependent upon your input. Please take a minute to visit. And, to prevent that annoying spam, we ask that you register.

Link: http://feeds.feedburner.com/HealthcareFinancialsthePostForcxos

Conclusion

Your thoughts and comments on this ME-P are appreciated. Feel free to review our top-left column, and top-right sidebar materials, links, URLs and related websites, too. Then, subscribe to the ME-P. It is fast, free and secure.

Speaker: If you need a moderator or speaker for an upcoming event, Dr. David E. Marcinko; MBA – Publisher-in-Chief of the Medical Executive-Post – is available for seminar or speaking engagements. Contact: MarcinkoAdvisors@msn.com

OUR OTHER PRINT BOOKS AND RELATED INFORMATION SOURCES:

Risk Management, Liability Insurance, and Asset Protection Strategies for Doctors and Advisors: Best Practices from Leading Consultants and Certified Medical Planners™8Comprehensive Financial Planning Strategies for Doctors and Advisors: Best Practices from Leading Consultants and Certified Medical Planners™

Attention Physician Investors [Don’t Get Soft]

Join Our Mailing List 

On “Easy” … Investing

By Lon Jefferies MBA CFP®

Lon JeffriesDo you realize how easy physicians, and most all investors, have had it lately? There is almost always something happening in the world that can serve as justification for selling investment positions or not investing new dollars.

Yet, there hasn’t been many spooky events impacting the markets during the last several months.

So, let’s examine the investment environment we’ve recently enjoyed.

Geo-political Current Events

There is almost always geopolitical current events that are capable of scaring investment markets. While this generation will always have concern about ISIS, North Korea, Iran, Afghanistan, and terrorism, we haven’t recently experienced the kind of negative political event that has immediately sent the stock market into a tailspin.

Even stories regarding missile strikes in Gaza have been few and far between. The most relevant international political event of late is the United States’ increased cooperation with Raul Castro and Cuba — a positive event.

Global economic situations also have the ability to increase volatility in the stock market. Yet, we haven’t recently been bombarded with headlines about excessive debt in Argentina or other countries on the doorstep of financial collapse.

Actually, international markets are the big investment story thus far in 2015, with Europe, Asia, and emerging markets outperforming U.S. stocks.

Social Tragedies

Social tragedies also have the ability to move the markets. I believe the most dominant story regarding social issues of late has been the horrific stories of potential racism and excessive police violence.

Of course, these events are shocking and unfortunate, but they aren’t usually the type of stories that impact investment markets.

Fortunately, I’m not aware of any school shootings, mass suicides, or broad violent attacks on U.S. soil that have caused a national mourning in 2015.

Natural Disasters

Further, there have been relatively few natural disasters such as hurricanes, earthquakes, or tornados that have significantly set back a geographic area or the nation as a whole.

In fact, the Weather Channel announced that the tornado count is 59 percent below average year-to-date. There were some large snow storms in the North-East earlier this year, but they had a nominal impact on the direction of the stock market.

US Economy

Even the U.S. economy hasn’t produced any data that has been particularly frightening to investors. It was all the way back in October that the Federal Reserve announced the ending of its quantitative easing (QE) program, which caused some to wonder if the economy would start to dry up (it hasn’t…). The concern about potentially higher interest rates has been present for so long that it is now old news, and people seem less and less convinced that higher interest rates would significantly stall the economy. Meanwhile, the unemployment rate continues to decline.

***

statistics ***

Lastly, the stock market itself has hardly provided reason for heartburn. The total return of the S&P 500 has been positive every year since 2008. The index hasn’t even had a temporary pullback of more than -7.27% (9/18/14 – 10/16/14) since 2011, even though the market historically goes through a -10% correction approximately once per year, on average. In fact, the biggest investment concern of 2014 was that small cap and international stocks didn’t make as much as large cap stocks, causing most diversified portfolios to underperform the larger market indexes such as the S&P 500 and Dow Jones Industrial Average. If your largest investing disappointment is that every part of your diversified portfolio didn’t perform as well as the best performing asset category in the market, you should really focus less on your portfolio and more on enjoying life as a whole.

Volatility

When we examine the factors that typically lead to volatility in the market, we’ve had a relatively tame past couple of months. My purpose in pointing out this fact is not to imply that the market is in a prime position to continue to do well nor on the verge of dropping drastically when the next sign of uncertainty appears. I simply hope to remind investors that the stock market is not always such a smooth ride.

Adverse Actions

The most counter-productive action an investor can take is to liquidate their positions after the market drops. I believe the best way to avoid this mistake is to constantly remind yourself that you are investing for long-term results and that short-term (and potentially drastic) volatility is certain to occur.

Reminding yourself of this fact now, before the volatility arrives, is likely to increase the probability that you will be able to stick to your long-term investment strategy during both the good and bad periods of market performance.

Enter Carl Richards

As Carl Richards points out in his new book The One-Page Financial Plan, no skydiver would try to figure out how a parachute works after jumping out of a plane. Sooner or later, an unfortunate event that will negatively impact the stock market is certain to occur. At that time, remember that just as it always has, the world will continue to turn.

Furthermore, remember that the longer you allow the world to turn, the more positive your investment results are likely to be.

Assessment

Don’t let this unusually quite investment period make you more susceptible to short-term instability once it returns.

Editor’s Note: Since writing this article, the world has experienced the catastrophic earthquake in Nepal on April 25th as well as the horrific riots in Baltimore, which started on April 27th. While these are certainly not the type of events that make the world a better place, the negative impact these occurrences have had on the stock market have again been relatively small, with the S&P 500 decreasing by a total of only 0.50% during the three days following these events [4/27 – 4/29]. Still, I would encourage investors to view these recent events as a reminder that investing and life in general is not always a smooth ride.)

More: 

Conclusion

Your thoughts and comments on this ME-P are appreciated. Feel free to review our top-left column, and top-right sidebar materials, links, URLs and related websites, too. Then, subscribe to the ME-P. It is fast, free and secure.

Speaker: If you need a moderator or speaker for an upcoming event, Dr. David E. Marcinko; MBA – Publisher-in-Chief of the Medical Executive-Post – is available for seminar or speaking engagements. Contact: MarcinkoAdvisors@msn.com

OUR OTHER PRINT BOOKS AND RELATED INFORMATION SOURCES:

Comprehensive Financial Planning Strategies for Doctors and Advisors: Best Practices from Leading Consultants and Certified Medical Planners(TM)

Morningstar Expense Ratio Study Shows Fund Costs Falling

Join Our Mailing List

Asset-Weighted Expense Ratios and Market Share

By Morningstar

***

tumblr_nnzc1ahE8I1u8swf1o1_1280

[Click to Enlarge]

Conclusion

Your thoughts and comments on this ME-P are appreciated. Feel free to review our top-left column, and top-right sidebar materials, links, URLs and related websites, too. Then, subscribe to the ME-P. It is fast, free and secure.

Speaker: If you need a moderator or speaker for an upcoming event, Dr. David E. Marcinko; MBA – Publisher-in-Chief of the Medical Executive-Post – is available for seminar or speaking engagements. Contact: MarcinkoAdvisors@msn.com

OUR OTHER PRINT BOOKS AND RELATED INFORMATION SOURCES:

Comprehensive Financial Planning Strategies for Doctors and Advisors: Best Practices from Leading Consultants and Certified Medical Planners(TM)

Crowd-Sourcing Financial Advice?

Join Our Mailing List 

By Dr. David E. Marcinko MBA

If you have some eggs about to expire, or a car that has problems, you can turn to an online community to find some solutions. But, what if you have a financial issue, like what to do with a windfall or how to invest for a kids’ college tuition, and need help?

Can you crowdsource financial advice? 

Ramon Ramirez writes on the Daily Dot’s The Kernel about the personal finance section of Reddit, where people ask for, and receive, all types of advice on personal financial matters; The subreddit has 2.7 million subscribers.

Ramirez finds that “for the armchair experts … weighing in on these questions pro bono is all in a day’s work. They are generally affable, seemingly trustworthy, and largely convincing.” But, one professor of personal finance sees a problem: “Six people suggest six different things to do—now what do I do?

Professor Speak

First of all, who are these people that are answering this plea? Are they professionals? Are they certified financial planners? Do they have any idea what they’re talking about?”

Others say the peer-review part of crowdsourced advice is its most valuable aspect.

“Compare this to a traditional financial advisor. If you’re in here asking about what to invest your retirement into, and I’m suggesting funds that personally enrich me, I’ll get called out on it.”

Left unsaid, but surely true, is how investors will increasingly turn to sites like this to validate their advisors’ advice, or learn why they should change advisors.

***

Soldiers

 ***

***

Assessment

First we had crowd sourced funding, then crowd sourced medicine … and now crowd sourced investing! Prudent, or NOT?

More:

Crowd-Funding:

MORE: P2P

Conclusion

Your thoughts and comments on this ME-P are appreciated. Feel free to review our top-left column, and top-right sidebar materials, links, URLs and related websites, too. Then, subscribe to the ME-P. It is fast, free and secure.

Speaker: If you need a moderator or speaker for an upcoming event, Dr. David E. Marcinko; MBA – Publisher-in-Chief of the Medical Executive-Post – is available for seminar or speaking engagements. Contact: MarcinkoAdvisors@msn.com

OUR OTHER PRINT BOOKS AND RELATED INFORMATION SOURCES:

Comprehensive Financial Planning Strategies for Doctors and Advisors: Best Practices from Leading Consultants and Certified Medical Planners(TM)

Video on Six Costly Investment Behaviors

Join Our Mailing List

Pathetic results compared to the markets

[Principal of MZ Capital Management]

[Contributor to Morningstar and Physicians Practice]

Most investors are very good at hurting themselves financially. According to latest release of Dalbar’s Quantitative Analysis of Investor Behavior (QAIB), the average investor has a return of only 2.6% over the last ten years. That’s pathetic compared to what the markets gave. See the chart below, over the same period, the S&P 500 gave an annualized return of 7.4% and the bond market gave 4.6%.

***

ImageProxy

[Click to Enlarge]

***

Investor behaviors are such a big drag on investment returns that Nobel Prize winner Daniel Kahneman, an Israeli American, advised Israel’s Pension Authority to send out statements once a quarter instead of once a month. Since when Israel’s pensioners don’t get their statements, they don’t do stupid things to their accounts.

So what are those behaviors that are so costly to investment returns? Please watch this five minute long video produced by Independence Advisors.

In a nutshell, the emotional reactions (such as herding) that had helped our hunter-gatherer forebears survive so well and thus are hard-wired into our brains are literally hazardous to successful investing. In a way, the value of an advisor like myself is to separate your emotions from your money.

Assessment

So, how does this relate to physicians and other medical professionals; better or worse?

Conclusion

Your thoughts and comments on this ME-P are appreciated. Feel free to review our top-left column, and top-right sidebar materials, links, URLs and related websites, too. Then, subscribe to the ME-P. It is fast, free and secure.

Speaker: If you need a moderator or speaker for an upcoming event, Dr. David E. Marcinko; MBA – Publisher-in-Chief of the Medical Executive-Post – is available for seminar or speaking engagements. Contact: MarcinkoAdvisors@msn.com

OUR OTHER PRINT BOOKS AND RELATED INFORMATION SOURCES:

Comprehensive Financial Planning Strategies for Doctors and Advisors: Best Practices from Leading Consultants and Certified Medical Planners(TM)

Living and Dying on Financial Planning Averages

Join Our Mailing List

Too simplest … Too manageable?

By Lon Jeffries MBA CFP CMP®

Lon JeffriesNever forget the story of the six-foot tall man who drowned crossing the stream that was only five feet deep, on average.

We want to abide by averages because they make our lives simple and manageable. A couple on a date night assumes a movie will be an average of two hours long so they know when to schedule dinner with friends.

The entrepreneur wants to think in terms of making an average profit of $100,000 per year so he has a guideline regarding the standard of living he can enjoy.

The 65-year old retiree wants to assume he will live to the average age of 84.3 so he knows at what pace he can enjoy his nest egg.

Planning Gone Awry

However, when we rely too heavily on averages, our planning can go awry. If the movie runs longer than two hours, the couple will be late for their dinner date. If the entrepreneur has a slow year and earns less than $100,000, he may end up taking out short term debt to pay his bills. If the retiree lives past age 84.3, he may outlive his money.

Financial Planning Averages

The use of averages is essential in financial planning. A range of assumptions is required in the development of a financial plan – how long will you live, how much will you spend each year, what rate of return will your investments achieve, how much will you pay in taxes, what will the rate of inflation be, etc. Without these assumptions, retirement projections can’t be constructed. Further, the best method for making these assumptions is to use averages – an average life expectancy, an historical average rate of return, an historical average inflation rate, etc.

So, how do we prevent the use of averages from destroying us? The answer is by allowing enough time and repetitions for the law of averages to come into effect. Just because a basketball player shoots free throw shots at a 90% success rate doesn’t mean he will necessarily make the next free throw he takes. It does, however, mean that if he shoots 100 free throws he is likely to make 90 of them.

Beware Assumptions

A financial plan may assume you achieve an average annual rate of return of 7% per year. Of course, this doesn’t mean it is impossible that your portfolio will actually lose 10% over the next 12 months. It is critical to remember that the financial plan assumes you achieve a 7% return over the entirety of your retirement, which may be 30 years. Consequently, if a loss of 10% occurs in the first year of retirement, your portfolio still has another 29 years to achieve returns that average out to 7% per year. Thus, a 10% loss is far from catastrophic to your retirement projections.

In fact, the primary way a 10% loss could become catastrophic to your portfolio is if it motivates you to make changes to your investments that would prevent the law of averages from applying. If an investor sold their portfolio after suffering the 10% loss, it would essentially guarantee that the anticipated average rate of return won’t be achieved, and consequently, the financial plan would be likely to fail.

***

Bell Curve

***

For this reason, while it is true that over an extended period of time the stock market has averaged an annual return of 10%, we should always remember that there is a significant chance of the market taking a loss during any given year (or three-year) period, and it is possible that the market could endure a decade without any significant gains (similar to the 2000’s).

Still, if the financial plan requires an average investment return over an extended period of time such as a 30-year retirement, even these setbacks are far from certain to dislodge your secure retirement as long as time is granted for the average to work itself out.

Enter Howard Marks

As famed writer and investor Howard Marks said,

“We can’t live by the averages. We can’t say ‘well, I’m happy to survive, on average.’ We gotta survive on the bad days. If you’re a decision maker, you have to survive long enough for the correctness of your decision to become evident. You can’t count on it happening right away.”

Assessment

The use of averages has a purpose in financial planning, and in other aspects of life. We simply need to be confident that the figures we use for our averages are achievable over time, and allow time the opportunity to prove us right.

Pareto’s Law or Principle

The Pareto principle (also known as the 80–20 rule, the law of the vital few, and the principle of factor sparsity) states that, for many events, roughly 80% of the effects come from 20% of the causes Management consultant Joseph M. Juran suggested the principle and named it after Italian economist Vilfredo Pareto, who, while at the University of Lausanne in 1896, published his first paper “Cours d’économie politique.” Essentially, Pareto showed that approximately 80% of the land in Italy was owned by 20% of the population; Pareto developed the principle by observing that 20% of the pea pods in his garden contained 80% of the peas.

It is a common rule of thumb in business; e.g., “80% of your sales come from 20% of your clients.” Mathematically, the 80–20 rule is roughly followed by a power law distribution (also known as a Pareto distribution) for a particular set of parameters, and many natural phenomena have been shown empirically to exhibit such a distribution.[2]

The Pareto principle is only tangentially related to Pareto efficiency. Pareto developed both concepts in the context of the distribution of income and wealth among the population.

More: 

Conclusion

Your thoughts and comments on this ME-P are appreciated. Feel free to review our top-left column, and top-right sidebar materials, links, URLs and related websites, too. Then, subscribe to the ME-P. It is fast, free and secure.

Speaker: If you need a moderator or speaker for an upcoming event, Dr. David E. Marcinko; MBA – Publisher-in-Chief of the Medical Executive-Post – is available for seminar or speaking engagements. Contact: MarcinkoAdvisors@msn.com

OUR OTHER PRINT BOOKS AND RELATED INFORMATION SOURCES:

Comprehensive Financial Planning Strategies for Doctors and Advisors: Best Practices from Leading Consultants and Certified Medical Planners(TM)

Understanding Stock Market Performance Benchmarks

Join Our Mailing List

An important role in monitoring investment portfolio progress

By TIMOTHY J. McINTOSH; MBA, MPH, CFP®, CMP™ [Hon] 

tim

Performance measurement has an important role in monitoring progress toward any portfolio’s goals.  The portfolio’s objective may be to preserve the purchasing power of the assets by achieving returns above inflation or to have total returns adequate to satisfy an annual spending need without eroding original capital, etc.

Whatever the absolute goal, performance numbers need to be evaluated based on an understanding of the market environment over the period being measured.

So, here is a brief review for our ME-P readers, doctors and subscribers; after a good market day today.

17,666.40 +305.36 +1.76%

Time-weighted Returns

One way to put a portfolio’s a time-weighted return in the context of the overall market environment is to compare the performance to relevant alternative investment vehicles. This can be done through comparisons to either market indices, which are board baskets of investable securities, or peer groups, which are collections of returns from managers or funds investing in a similar universe of securities with similar objectives as the portfolio.  By evaluating the performance of alternatives that were available over the period, the investor and his/her advisor are able to gain insight to the general investment environment over the time period.

The Indices

Market indices are frequently used to gain perspective on the market environment and to evaluate how well the portfolio performed relative to that environment.  Market indices are typically segmented into different asset classes.

Common stock market indices include the following:

  • Dow Jones Industrial Average- a price-weighted index of 30 large U.S. corporations.
  • Standard & Poor’s (S&P) 500 Index – a capitalization-weighted index of 500 large U.S. corporations.
  • Value Line Index – an equally-weighted index of 1700 large U.S. corporations.
  • Russell 2000 – a capitalization-weighted index of smaller capitalization U.S. companies.
  • Wilshire 5000 – a cap weighted index of the 5000 largest US corporations.
  • Morgan Stanley Europe Australia, Far East (EAFE) Index – a capitalization-weighted index of the stocks traded in developed economies.

Common bond market indices include the following:

  • Barclays Aggregate Bond Index – a broad index of bonds.
  • Merrill Lynch High Yield Index – an index of below investment grade bonds.
  • JP Morgan Global Government Bond – an index of domestic and foreign government-issued fixed income securities.

The selection of an appropriate market index depends on the goals of the portfolio and the universe of securities from which the portfolio was selected. Just as a portfolio with a short-time horizon and a primary goal of capital preservation should not be expected to perform in line with the S&P 500, a portfolio with a long-term horizon and a primary goal of capital growth should not be evaluated versus Treasury Bills.

***

Healthcare job expense deductions

***

While the Dow Jones Industrial Average and S&P 500 are often quoted in the newspapers, there are clearly broader market indices available to describe the overall performance of the U.S. stock market. Likewise, indices like the S&P 500 and Wilshire 5000 are capitalization-weighted, so their returns are generally dominated by the largest 50 of their 500 – 5000 stocks. Although this capitalization-bias does not typically affect long-term performance comparisons, there may be periods of time in which large cap stocks out- or under-perform mid-to-small cap stocks, thus creating a bias when cap-weighted indices are used versus what is usually non-cap weighted strategies of managers or mutual funds. Finally, the fixed income indices tend to have a bias towards intermediate-term securities versus longer-term bonds.

Peer Groups

Thus, an investor with a long-term time horizon, and therefore potentially a higher allocation to long bonds, should keep this bias in mind when evaluating performance.Peer group comparisons tend to avoid the capitalization-bias of many market indices, although identifying an appropriate peer group is as difficult as identifying an appropriate market index.

Furthermore, peer group universes will tend to have an additional problem of survivorship bias, which is the loss of (generally weaker) performance track records from the database. This is the greatest concern with databases used for marketing purposes by managers, since investment products in these generally self-disclosure databases will be added when a track record looks good and dropped when the product’s returns falter. Whether mutual funds or managers, the potential for survivorship bias and inappropriate manager universes make it important to evaluate the details of how a database is constructed before using it for relative performance comparisons.

***

investing

***

Channel Surfing the ME-P

Have you visited our other topic channels? Established to facilitate idea exchange and link our community together, the value of these topics is dependent upon your input. Please take a minute to visit. And, to prevent that annoying spam, we ask that you register. It is fast, free and secure.

The Author

Timothy J. McIntosh is Chief Investment Officer and founder of SIPCO.  As chairman of the firm’s investment committee, he oversees all aspects of major client accounts and serves as lead portfolio manager for the firm’s equity and bond portfolios. Mr. McIntosh was a Professor of Finance at Eckerd College from 1998 to 2008. He is the author of The Bear Market Survival Guide and the The Sector Strategist.  He is featured in publications like the Wall Street Journal, New York Times, USA Today, Investment Advisor, Fortune, MD News, Tampa Doctor’s Life, and The St. Petersburg Times.  He has been recognized as a Five Star Wealth Manager in Texas Monthly magazine; and continuously named as Medical Economics’ “Best Financial Advisors for Physicians since 2004.  And, he is a contributor to SeekingAlpha.com., a premier website of investment opinion. Mr. McIntosh earned a Bachelor of Science Degree in Economics from Florida State University; Master of Business Administration (M.B.A) degree from the University of Sarasota; Master of Public Health Degree (M.P.H) from the University of South Florida and is a CERTIFIED FINANCIAL PLANNER® practitioner. His previous experience includes employment with Blue Cross/Blue Shield of Florida, Enterprise Leasing Company, and the United States Army Military Intelligence.

Conclusion

Your thoughts and comments on this ME-P are appreciated. Feel free to review our top-left column, and top-right sidebar materials, links, URLs and related websites, too. Then, subscribe to the ME-P. It is fast, free and secure.

Speaker: If you need a moderator or speaker for an upcoming event, Dr. David E. Marcinko; MBA – Publisher-in-Chief of the Medical Executive-Post – is available for seminar or speaking engagements. Contact: MarcinkoAdvisors@msn.com

OUR OTHER PRINT BOOKS AND RELATED INFORMATION SOURCES:

Comprehensive Financial Planning Strategies for Doctors and Advisors: Best Practices from Leading Consultants and Certified Medical Planners(TM)

An Educational Niche Resource Supporting Doctors and their Consulting Advisors

Join Our Mailing List

By Eugene Schmuckler PhD MBA MEd CTS [Academic Provost]

About the Medical Executive-Post

We are an emerging online and onground community that connects medical professionals with financial advisors and management consultants.

We participate in a variety of insightful educational seminars, teaching conferences and national workshops. We produce journals, textbooks and handbooks, white-papers, CDs and award-winning dictionaries. And, our didactic heritage includes innovative R&D, litigation support, opinions for engaged private clients and media sourcing in the sectors we passionately serve.

Through the balanced collaboration of this rich-media sharing and ranking forum, we have become a leading network at the intersection of healthcare administration, practice management, medical economics, business strategy and financial planning for doctors and their consulting advisors. Even if not seeking our products or services, we hope this knowledge silo is useful to you.

In the Health 2.0 era of political reform, our goal is to: “bridge the gap between practice mission and financial solidarity for all medical professionals.”

More: Letterhead.iMBA_Inc.

***

niche

 ***

Enter the Certified Medical Planners™

There is no certification program, course of study or professional designation for FAs who wish to enter the lucrative financial planning space serving physicians and healthcare professionals.

That’s why the R&D efforts of our governing board of physician-directors, accountants, financial advisors, academics and health economists identified the need for integrated personal financial planning and medical practice management as an effective first step in the survival and wealth building life-cycle for physicians, nurses, healthcare executives, administrators and all medical professionals.

Now – more than ever – desperate doctors of all ages are turning to knowledge able financial advisors and medical management consultants for help. Symbiotically too, generalist advisors are finding that the mutual need for extreme niche synergy is obvious.

But, there was no established curriculum or educational program; no corpus of knowledge or codifying terms-of-art; no academic gravitas or fiduciary accountability; and certainly no identifying professional designation that demonstrated integrated subject matter expertise for the increasingly unique healthcare focused financial advisory niche … Until Now!

Enter the Certified Medical Planner™ charter professional designation. And, CMPs™ are FIDUCIARIES, 24/7.

FAs

Video: http://vimeo.com/84247360

An Interview with Bennett Aikin AIF®

Physician-Investors and the “F” Word

More:

Channel Surfing the ME-P

Have you visited our other topic channels? Established to facilitate idea exchange and link our community together, the value of these topics is dependent upon your input. Please take a minute to visit. And, to prevent that annoying spam, we ask that you register. It is fast, free and secure.

Conclusion

Your thoughts and comments on this ME-P are appreciated. Feel free to review our top-left column, and top-right sidebar materials, links, URLs and related websites, too. Then, subscribe to the ME-P. It is fast, free and secure.

Speaker: If you need a moderator or speaker for an upcoming event, Dr. David E. Marcinko; MBA – Publisher-in-Chief of the Medical Executive-Post – is available for seminar or speaking engagements. Contact: MarcinkoAdvisors@msn.com

OUR OTHER PRINT BOOKS AND RELATED INFORMATION SOURCES:

Comprehensive Financial Planning Strategies for Doctors and Advisors: Best Practices from Leading Consultants and Certified Medical Planners(TM)

How may we assist you?

← Back

Thank you for your response. ✨

Warning
Warning
Warning
Warning

Warning.

2015 Could Be Rough on Stocks?

Join Our Mailing List

Here’s Why!

Daniel Crosby PhDBy Daniel Crosby, Ph.D.

“In the short run, the market is a voting machine but in the long run, it is a weighing machine.” – Benjamin Graham

***

Believing as I do in the sage advice of Mr. Graham, I recently set out to quantify my growing unease with the heights obtained by the bull market of the last five-plus years. As you read below, please realize that this is not a forecast or prognostication about what will happen – especially not in the short term. Timing the market on any sort of a short-term basis is a fool’s errand, as is deviating from your specific financial plan on the advice of a stranger.

Consider this more of a “Where are we at?” with respect to market valuations, secure in the knowledge that times of sensational highs and lows tend to be fleeting and that the market has a tendency to mean-revert (that is, become a weighing machine) in the long term. Having now sufficiently hemmed and hawed my way through the legal stuff – let me say that I find the market significantly overvalued and think that some sort of defensive measures will be wise for most investors in the year(s) to come.

The Levels

To corroborate this belief, I’d like to present you with four measures of market value, all at historically high levels. They are:

  1. Shiller Cyclically Adjusted Price to Earnings Ratio (CAPE)

What it is – The work of Nobel Prize winning behavioral economist Robert Shiller, the CAPE is the price/earnings ratio based on average, inflation-adjusted earnings for the previous ten years.

What it says – The CAPE currently sits at 27.2, 63.9% higher than its’ historical mean of 16.6. The CAPE has only crested or approached 27 three other times – 1929, 1997-2000, and 2007.

What it means – The CAPE is a poor predictor of short-term market movements (most everything is), but is much more reliable in speaking to the long term return horizon. Using Shiller’s own expected return formula (taken from value investing site GuruFocus), yields an expected return over the next 8 years of .3%. What is much more informative than a single prediction, however, is considering the range of possible distributions for the longer term, which are as follows:

Scenario Returns for next 8 years from today

Really Lucky 5.2%

Lucky 3%

Unlucky -3%

Really Unlucky -7.5%

It is certainly worth noting that even the “Really Lucky” scenario that might play out over the next 8 years vastly underperforms the market average.

  1. S&P 500 Price to Earnings Ratio

What it is – A simple measure of the price paid for every dollar of earnings among some of the best capitalized and most liquid US securities.

What it says – The current P/E ratio of the S&P 500 is 19.96, well above it’s historical mean of 15.53 and median of 14.57.

What it means – As with the Shiller CAPE, greatly elevated levels of price to earnings have signaled a much lower return environment in the years to come. Ned Davis research has done the math on times when the market has been over or undervalued relative to fundamentals and has discovered the following:

Returns of S&P 500 Percentage Over/Under Valued (3-31-1926 to 5-31-2014)

More than 20% Overvalued (parentheses denote negative returns)

6 months – (.2)

1 year – (3.6)

2 years – (1.6)

3 years – 6.8

More than 20% Undervalued

6 months – 14

1 year – 19.4

2 years – 30.1

3 years – 47.3

Market Performance

6 months – 3.9

1 year – 8

2 years – 16

3 years – 23.6

According to Ned Davis and company, we are now well over 30% overvalued, comfortably above the threshold for the paltry “Overvalued” returns you see above.

*** future***

  1. Wilshire 5000/GDP – aka, “Buffett Valuation Indicator”

What it is – A sort of price to sales marker for the broader economy, once mentioned by Buffett as his favorite measure of market valuation.

What it says – The current market cap/GDP ratio sits at 127.3%, which is more than two standard deviations from the mean value of 68.8%.

What it meansGiven historical returns from this significantly elevated level of market cap to GDP, the predicted return for ’15 is .7%, which includes dividends. Drawing on Buffett’s comments, GuruFocus considers a 75 to 90% ratio fair value, with 90 to 115% modestly overvalued and anything over 115% significantly overvalued. The only other time since 1950 that this indicator has broken past two standard deviations of overvaluation is, you guessed it, in the run up to the 2000 crash.

  1. Crosby Irrationality Index

What it is – A measure of market sentiment that is comprised of sub-measures of volatility, valuation, fund flows, momentum and interest rate spreads.

What it says – The CII has spent all of 2014 at a level of elevated optimism just short of mania. While valuations have driven the score up, it has not reached “manic” levels, largely as a result of this having been “the most hated bull run in history.”

What it means – The CII provides one and three year projections based on the current levels of market sentiment. These projections should be understood less as specific predictions and more as headwinds or tailwinds to growth. The current projections are for slightly negative (-1.001) returns this year that persist even three years down the road (-2.6266).

Caveats

As with any measure, those listed above are subject to a number of failings. The CAPE includes data from the Great Recession that skew the results, a number of the measures fail to account for the interest rate environment, and so on. While no single measure is flawless, when so many measures point in the same direction, I believe it is worth taking note.

This information in and of itself is meaningless but should take on meaning as you discuss your individual needs with your advisor (you DO have an advisor, right?).

More:

For very long-term investors, even profound hiccups in the market may be little more than a contrarian buying opportunity. After all, there are more fun and important things to do in life than obsess over financial footnotes.

Assessment

But for those nearing retirement, an unambiguous picture seems to be emerging that returns for the next 8 to 10 years are likely to be depressed in light of the eye-popping returns of the more recent past. Do not act in haste or deviate from your plan if one is in place, but please accept this gentle warning from a concerned party who knows that “this time is never different.”

Even More:

Channel Surfing the ME-P

Have you visited our other topic channels? Established to facilitate idea exchange and link our community together, the value of these topics is dependent upon your input. Please take a minute to visit. And, to prevent that annoying spam, we ask that you register. It is fast, free and secure.

Conclusion

Your thoughts and comments on this ME-P are appreciated. Feel free to review our top-left column, and top-right sidebar materials, links, URLs and related websites, too. Then, subscribe to the ME-P. It is fast, free and secure.

Speaker: If you need a moderator or speaker for an upcoming event, Dr. David E. Marcinko; MBA – Publisher-in-Chief of the Medical Executive-Post – is available for seminar or speaking engagements. Contact: MarcinkoAdvisors@msn.com

OUR OTHER PRINT BOOKS AND RELATED INFORMATION SOURCES:

Comprehensive Financial Planning Strategies for Doctors and Advisors: Best Practices from Leading Consultants and Certified Medical Planners(TM)

On Hospital Endowment Fund Management

Join Our Mailing List

A Case Model Example

[By Dr. David Edward Marcinko MBA]

http://www.CertifiedMedicalPlanner.org

DEM at Wharton

Just as the field of medicine continuously changes, so too does the field of endowment management.

Endowment managers continue to increase their knowledge of the science and expand their skill in the art.

However, successful endowment managers will continue to focus on the areas that they can control in order to minimize the risk of the areas they cannot.

***

So, here is a case model to show you how it is done.

[Case Model]

Endowment Fund

***

hospital

Invite Dr. Marcinko

***

Channel Surfing the ME-P

Have you visited our other topic channels? Established to facilitate idea exchange and link our community together, the value of these topics is dependent upon your input. Please take a minute to visit. And, to prevent that annoying spam, we ask that you register. It is fast, free and secure.

More:

Conclusion

Your thoughts and comments on this ME-P are appreciated. Feel free to review our top-left column, and top-right sidebar materials, links, URLs and related websites, too. Then, subscribe to the ME-P. It is fast, free and secure.

Speaker: If you need a moderator or speaker for an upcoming event, Dr. David E. Marcinko; MBA – Publisher-in-Chief of the Medical Executive-Post – is available for seminar or speaking engagements. Contact: MarcinkoAdvisors@msn.com

OUR OTHER PRINT BOOKS AND RELATED INFORMATION SOURCES:

Product DetailsProduct Details

***

A Video Presentation by Political Economic Strategist Greg R. Valliere

Join Our Mailing List

Chief Political and Economic Strategist at Potomac Research Group Holdings, LLC

Video Pod-Cast Sponsored By

  • Sharkey, Howes & Javer
  • 720 S Colorado Blvd – So. Tower, Suite 600
  • Denver, CO 80246

Dear David,

We thoroughly enjoyed our time with those of you who were able to attend our annual Client and Friends Appreciation Event.

Since then, many of you have been requesting to see Greg R. Valliere’s presentation from the event. So, we recently posted the video on our website and would like to invite you, your family and friends to view it. If you missed the event, Greg’s speech was thought provoking, insightful and is well worth a watch.

Enjoy!

SHJ

***

Watch

< Click here to watch now >

SHJ

***

About Greg R. Valliere

Greg R. Valliere is a Chief Political Strategist at Potomac Research Group Holdings, LLC. He coordinates political and economic research. Mr. Valliere focuses on how Congress and the White House shape fiscal policies and monitors the Federal Reserve Board’s interest rate policies. He has over 30 years of experience in covering Washington for institutional investors. 

Prior to joining the firm, Mr. Valliere served as Chief Policy Strategist for Soleil Securities Group Inc. He was also employed at Stanford Group Company, Research Division. He previously held key strategy roles at Charles Schwab’s Washington Research Group and The Washington Forum. 

Mr. Valliere co-founded The Washington Forum in 1974, serving as Chief Political Analyst and Editor of the group’s publications, and ultimately as Research Director. He began his career in 1972 at F-D-C reports, monitoring the pharmaceutical industry. Mr. Valliere is an exclusive commentator for CNBC, appearing regularly on network programs such as ‘Squawk Box,’ ‘Power Lunch,’ ‘The Closing Bell,’ and ‘Kudlow & Company.’ He earned his Bachelor’s degree in Journalism from The George Washington University.

Channel Surfing the ME-P

Have you visited our other topic channels? Established to facilitate idea exchange and link our community together, the value of these topics is dependent upon your input. Please take a minute to visit. And, to prevent that annoying spam, we ask that you register. It is fast, free and secure.

Conclusion

Your thoughts and comments on this ME-P are appreciated. Feel free to review our top-left column, and top-right sidebar materials, links, URLs and related websites, too. Then, subscribe to the ME-P. It is fast, free and secure.

Speaker: If you need a moderator or speaker for an upcoming event, Dr. David E. Marcinko; MBA – Publisher-in-Chief of the Medical Executive-Post – is available for seminar or speaking engagements. Contact: MarcinkoAdvisors@msn.com

OUR OTHER PRINT BOOKS AND RELATED INFORMATION SOURCES:

Financial Planning MDs 2015

Comprehensive Financial Planning Strategies for Doctors and Advisors: Best Practices from Leading Consultants

About the INSTITUTE OF MEDICAL BUSINESS ADVISORS, Inc.

Join Our Mailing List

About

INSTITUTE OF MEDICAL BUSINESS ADVISORS, Inc.

  ***

The Institute of Medical Business Advisors, Inc provides a team of experienced, senior level consultants led by iMBA Chief Executive Officer Dr. David Edward Marcinko MBA CMPMBBS [Hon] and President Hope Rachel Hetico RN MHA CMP™ to provide going contact with our clients throughout all phases of each project, with most of the communications between iMBA and the key client participants flowing through this Senior Team.

Product Details

iMBA Inc., and its skilled staff of certified professionals have many years of significant experience, enjoy a national reputation in the healthcare consulting field, and are supported by an unsurpassed research and support staff of CPAs, MBAs, MPHs, PhDs, CMPs™, CFPs® and JDs to maintain a thorough and extensive knowledge of the healthcare environment.

Product Details

The iMBA team approach emphasizes providing superior service in a timely, cost-effective manner to our clients by working together to focus on identifying and presenting solutions for our clients’ unique, individual needs.

Product Details

The iMBA Inc project team’s exclusive focus on the healthcare industry provides a unique advantage for our clients.  Over the years, our industry specialization has allowed iMBA to maintain instantaneous access to a comprehensive collection of healthcare industry-focused data comprised of both historically-significant resources as well as the most recent information available.  iMBA Inc’s specific, in-depth knowledge and understanding of the “value drivers” in various healthcare markets, in addition to the transaction marketplace for healthcare entities, will provide you with a level of confidence unsurpassed in the public health, health economics, management, administration, and financial planning and consulting fields.

 Product DetailsProduct DetailsProduct Details

iMBA Inc’s information resources and network of healthcare industry textbook resources enhanced by our professional consultants and research staff, ensure that the iMBA project team will maintain the highest level of knowledge regarding the current and future trends of the specific specialty market related to the project, as well as the healthcare industry overall, which serves as the “foundation” for each of our client engagements.

Product Details  Product Details

Ann Miller RN MHA

www.MedicalBusinessAdvisors.com

Financial Advisor Education Letterhead CMP

Solicitation Letterhead.iMBA, Inc

Sample iMBA Engagements

iMBA Seminar Topics

***

Financial Planning MDs 2015

Comprehensive Financial Planning Strategies for Doctors and Advisors: Best Practices from Leading Consultants and Certified Medical Planners™

***

Do You Have a Taxable Investment Account – Doctor?

Join Our Mailing List

Is it Time to Harvest?

[By Lon Jefferies MBA CFP®]

Lon JeffriesTax harvesting is the process of selling assets for the purpose of creating either long-term capital gains or losses to minimize your tax bill. This procedure is usually conducted near the end of a calendar year.

While many people are familiar with the concept of tax loss harvesting, fewer physicians or clients are familiar with the more recently developed process of tax gain harvesting. Between these two procedures, virtually everyone with a taxable (not tax-advantaged) investment account should make adjustments to their portfolio before the year ends.

Who Qualifies For the 0% Capital Gains Rate?

First, it is important to understand that capital gains (the growth on investments within a taxable, non retirement investment account) are taxed differently than ordinary income (wages, pensions, Social Security, IRA distributions, etc.). While short-term capital gains (recognized on the sale of assets held less than a year) are essentially considered ordinary income, long term capital gains, or recognized gains on assets held more than a year, are taxed at advantageous tax rates. While ordinary income tax rates range from 10% to 39.6%, capital gains tax rates range from 0% to 20%.

Second, it is crucial to understand what enables a taxpayer to qualify for the 0% capital gains rate. If a taxpayer is in the 10% or 15% ordinary income tax bracket, they qualify for the 0% long-term capital gains rate.

For a married couple filing jointly, the 15% tax bracket ends at $73,800 of taxable income ($36,900 for single taxpayers). Thus, if a married taxpayer has a taxable income (which includes long-term capital gains but is also after deductions and exemptions) of less than $73,800, all their long-term capital gains will be tax free. If the taxpayer is in a tax bracket anywhere between 25% and 35% (taxable income of $73,800 and $457,600, or between $36,900 and $406,750 for single tax filers), they will pay long-term capital gains taxes at 15%. Only those in the top tax bracket of 39.6% (married taxpayers with a taxable income over $457,600 and single taxpayers with taxable income over $406,750) will pay capital gains taxes at 20%.

Tax Loss Harvesting

During the calendar year, assets have been purchased and sold in most taxable investments accounts. The sale of an asset creates a net gain or loss, both having tax implications. Investors should have an understanding of what their long-term capital gains tax rate will be so they can determine whether a taxable gain or loss is preferable.

For instance, an individual who does not qualify for the 0% capital gains tax rate may wish to minimize the amount of taxable gains they recognize during the year, which would reduce their tax bill. If the investor currently has a net long-term capital gain (which is probable after the strong year the market had in 2013), then it is likely worthwhile to sell any assets in the portfolio that are currently worth less than the investor’s purchase price. This tax loss harvesting would reduce the net gain recognized during the year and lower the investor’s tax bill.

In some cases, by taking advantage of all potential losses within a portfolio an investor has the ability to negate all capital gains created during the year, completely eliminating their capital gains tax bill. Further, the IRS will allow investors to recognize a net capital loss of up to a -$3,000 per year. This -$3,000 loss can be used to lower the taxpayers ordinary income. This is particularly advantageous in that the capital loss reduces a type of income that is taxed at higher tax rates.

Harvesting Gains

Harvesting gains from a taxable portfolio is a more recently developed concept. Once the 0% long-term capital gains tax rate became a permanent part of the tax code with the passing of the American Taxpayer Relief Act of 2012 (signed January 2nd, 2013), in some scenarios it began making sense to recognize long-term capital gains on purpose to potentially avoid a larger tax bill in the future.

Suppose a taxpayer’s taxable income is consistently $65,000 a year. Additionally, suppose our hypothetical taxpayer won’t withdraw funds from his taxable account during the next few years, but may need a large lump sum distribution five years down the road. Recall that the 0% capital gains rate ends when a married taxpayer’s taxable income (which includes long-term capital gains) exceeds $73,800. Consequently, this hypothetical taxpayer has the ability to recognize $8,800 ($73,800 – $65,000) in long-term capital gains every year without increasing his tax bill. If this $8,800 in gains is recognized every year by simply selling and immediately repurchasing appreciated assets, he would raise the cost basis of his investment by $44,000 ($8,800 gain recognized annually for five straight years). He could then sell and withdraw that $44,000 without creating a tax liability.

Alternatively, if the investor does not harvest gains during the years when no distributions are taken, withdrawing $44,000 of gains five years down the road would create a sizable tax bill. He would still be able to recognize $8,800 of gains tax free in the year of distribution, but the remaining $35,200 of gains would cause his taxable income to be over the $73,800 limit, eliminating access to the 0% capital gains rate. That $35,200 would be taxed at the 15% capital gains rate, creating a federal tax bill of $5,280. With proper planning, this significant tax bill can be avoided.

***

Portfolio analysis

***

The Bottom Line

Tax harvesting has no purpose in tax-advantaged retirement accounts such as IRAs and 401ks because all distributions from these accounts are taxed as ordinary income. However, taxable individual or trust investment accounts can almost certainly benefit from tax harvesting. Speak to your accountant and financial planner to understand whether capital gains or losses are desirable for you this year and determine the amount of taxable gains already recognized. This will help you determine what type of harvesting should take place.

Tax harvesting can be a difficult and confusing concept. However, a competent financial planner who utilizes this procedure within your taxable investment account can significantly lower your tax bill. Speak to your adviser to ensure you are reaping the tax benefits available to you.

Channel Surfing the ME-P

Have you visited our other topic channels? Established to facilitate idea exchange and link our community together, the value of these topics is dependent upon your input. Please take a minute to visit. And, to prevent that annoying spam, we ask that you register. It is fast, free and secure.

Conclusion

Your thoughts and comments on this ME-P are appreciated. Feel free to review our top-left column, and top-right sidebar materials, links, URLs and related websites, too. Then, subscribe to the ME-P. It is fast, free and secure.

Speaker: If you need a moderator or speaker for an upcoming event, Dr. David E. Marcinko; MBA – Publisher-in-Chief of the Medical Executive-Post – is available for seminar or speaking engagements. Contact: MarcinkoAdvisors@msn.com

OUR OTHER PRINT BOOKS AND RELATED INFORMATION SOURCES:

Financial Planning MDs 2015

Comprehensive Financial Planning Strategies for Doctors and Advisors: Best Practices from Leading Consultants

My Stock Market Forecast for 2015

Join Our Mailing List 

All Forecasts Will Be Wrong

[By Lon Jefferies MBA CFP®]

Lon JeffriesThe investment media is a rare industry in which professionals are rewarded for making bold projections but never punished for being wrong. The more outlandish a pundit’s forecast the more attention it receives.

Yet, surprisingly little consideration is given to how accurate the prediction turns out to be.

At the beginning of 2014, there were some widely-accepted expectations regarding the investment environment.

Let’s review those predictions and analyze how precise they really were.

Interest Rates

In a study conducted by Bloomberg at the beginning of the year, all 72 economists surveyed predicted higher interest rates and falling bonds prices in 2014. Consequently, investors were questioning whether they should reduce or eliminate the bond portion of their portfolios until the rate increase occurred.

So, have we experienced this rise in interest rates?

On January 1st, 2014, the yield on the 10-year Treasury note was 3 percent. On November 13th, the yield on the same note was 2.35 percent. That’s right — interest rates actually decreased significantly during the year. As a result, intermediate U.S. government bonds (ticker – IEF) produced a return of 7.38% during the year. Not bad for the conservative portion of your portfolio!

Quantitative Easing

The most widely promoted fear among forecasters was that the phasing out of the Federal Reserve’s quantitative easing (QE) program would diminish stock returns. Prognosticators worried that the Fed would lower the amount of loans the government would buy from commercial banks, thus reducing the amount of money available for new businesses to borrow leading to less innovation and the creation of fewer jobs.

But, was the reduction of quantitative easing a legitimate fear? In fact, this possibility came to fruition. In December of 2013, the Federal Reserve was buying $85 billion of financial assets from commercial banks each month. The Fed reduced this amount during every meeting it held this year, finally eliminating the action completely in October.

However, the elimination of Quantitative Easing did not have a negative impact on the unemployment rate, which declined from 6.7% in January to 5.8% in October. Further, the S&P 500 has gained 12.31% year-to-date (as of 11/13/14). Clearly, fading out the Quantitative Easing program didn’t have the negative impact on stocks that many pundits expected.

Increased Volatility

Another widely held viewpoint at the beginning of the year was that 2014 was likely to be more volatile than anything experienced in 2012 or 2013. There was talk about valuations and P/E ratios being too high, concern about the war in Ukraine (ISIS wasn’t even in the headlines yet), and endless noise about unfavorable weather patterns impacting the market.

So, has 2014 been a wild ride? Since 1929, the S&P 500 has experienced either a rise or a decline of more than 1% during 23% of trading days. In 2014, the S&P 500 moved more than 1% only 15% of the time. Less movement equates to less volatility, so again forecasters were inaccurate.

2015 Forecasts

Bloomberg News recently published a story titled Predictors of ’29 Crash See 65% Chance of 2015 Recession, in which the grandson of a prognosticator who luckily forecasted the Great Depression is still getting attention for a guess his grandfather made 85 years ago. If giving credence to forecasters isn’t ridiculous enough, suggesting there is a gene for forecasting is insane!

The article doesn’t mention that the same grandson made similar headlines with the same forecast in both 2010 and 2012; of course, those predictions did not work out so well. You will start hearing many 2015 projections soon, so pay no heed.

***

glasses

***

Ignore the Pundits

The most significant lesson inherent in these numbers is that market expectations are essentially useless. Despite their abysmal track record, the news media loves forecasters because they capture attention and fill space. Unfortunately, pundits making projections are rarely held to their inaccurate forecasts and are allowed to continue making a living showing they have no greater knowledge than the average investor.

Of course, this is not to say that interest rates will never rise, that bond values will never decline, and that the market won’t return to the roller coaster it is. In fact, all those things are certain to happen. Unfortunately, anyone who contends to know “when” likely doesn’t actually know anymore than you or me. For this reason, having and sticking to a diversified investment strategy that coincides with a detailed financial plan is the most probable path to financial success.

More: 

Channel Surfing the ME-P

Have you visited our other topic channels? Established to facilitate idea exchange and link our community together, the value of these topics is dependent upon your input. Please take a minute to visit. And, to prevent that annoying spam, we ask that you register. It is fast, free and secure.

Conclusion

Your thoughts and comments on this ME-P are appreciated. Feel free to review our top-left column, and top-right sidebar materials, links, URLs and related websites, too. Then, subscribe to the ME-P. It is fast, free and secure.

Speaker: If you need a moderator or speaker for an upcoming event, Dr. David E. Marcinko; MBA – Publisher-in-Chief of the Medical Executive-Post – is available for seminar or speaking engagements. Contact: MarcinkoAdvisors@msn.com

OUR OTHER PRINT BOOKS AND RELATED INFORMATION SOURCES:

Comprehensive Financial Planning Strategies for Doctors and Advisors: Best Practices from Leading Consultants

2014 – A Near Record Year for IPOs

Join Our Mailing List

A 2014 Wrap-Up 

[By Inside the Ticker]

***

1

***

2

***

3

***

More:

Assessment

Channel Surfing the ME-P

Have you visited our other topic channels? Established to facilitate idea exchange and link our community together, the value of these topics is dependent upon your input. Please take a minute to visit. And, to prevent that annoying spam, we ask that you register. It is fast, free and secure.

Conclusion

Your thoughts and comments on this ME-P are appreciated. Feel free to review our top-left column, and top-right sidebar materials, links, URLs and related websites, too. Then, subscribe to the ME-P. It is fast, free and secure.

Speaker: If you need a moderator or speaker for an upcoming event, Dr. David E. Marcinko; MBA – Publisher-in-Chief of the Medical Executive-Post – is available for seminar or speaking engagements. Contact: MarcinkoAdvisors@msn.com

OUR OTHER PRINT BOOKS AND RELATED INFORMATION SOURCES:

Financial Planning MDs 2015

Comprehensive Financial Planning Strategies for Doctors and Advisors: Best Practices from Leading Consultants

***

Out-Look on Global Inflation Rates for 2015

Join Our Mailing List

A Mixed Picture

[By BNY Mellon]

inflation

[Click to Enlarge]

Channel Surfing the ME-P

Have you visited our other topic channels? Established to facilitate idea exchange and link our community together, the value of these topics is dependent upon your input. Please take a minute to visit. And, to prevent that annoying spam, we ask that you register. It is fast, free and secure.

More:

Conclusion

Your thoughts and comments on this ME-P are appreciated. Feel free to review our top-left column, and top-right sidebar materials, links, URLs and related websites, too. Then, subscribe to the ME-P. It is fast, free and secure.

Speaker: If you need a moderator or speaker for an upcoming event, Dr. David E. Marcinko; MBA – Publisher-in-Chief of the Medical Executive-Post – is available for seminar or speaking engagements. Contact: MarcinkoAdvisors@msn.com

OUR OTHER PRINT BOOKS AND RELATED INFORMATION SOURCES:

Financial Planning MDs 2015

Comprehensive Financial Planning Strategies for Doctors and Advisors: Best Practices from Leading Consultants and Certified Medical Planners™


Understanding the “Least” Important Issues for Physician-Investors

Join Our Mailing List 

A Dimensional Fund Advisors Survey

By Rick Kahler MS CFP® http://www.KahlerFinancial.com

Rick Kahler MS CFPIn this ME-P, I will focus on the three least important things investors want to know. The rankings came from a survey of investors, funded by Dimensional Fund Advisors, conducted in March 2014 by Advisor Impact.

All three deserved to be much higher on the list. In my experience, they are what most physicians and all investors really need to know.

The factors

These three factors are:

  • What are the chances the investment will lose money? Only 10% of investors thought it was important to ask about factors that contributed to historic performance. Just one-third thought it important to even ask about historical performance in general.
  • What type of volatility can they expect? Only 17% of investors considered this important.
  • How and why did the advisor select the investment for their portfolio? Only 21% of survey respondents thought this was important, and just 8% asked about the investment managers chosen.

Drilling Down and Going Granular

Some of these factors may seem difficult to understand, but they do matter. Give your financial advisor a chance to explain them; it can help you become a more informed investor.

ME-P Physicians

  1. Chances of losing money

This factor could be better addressed by asking about the specific factors that influenced historic performance of the security over various long-term economic climates. True, looking at the past performance of an investment is never a guarantee of future performance.

Yet, if the historical periods evaluated contain a variety of economic conditions (high inflation, various economic cycles, various political influences, etc.) and long-term holding periods (at least 10 years or more), looking backward may give you a reasonable idea of what future performance might look like.

  1. Volatility

Most investors will cognitively agree they fully understand that most investments that carry any chance of real (after inflation) significant long-term return will fluctuate. I say “cognitively” because, once that fluctuation happens on the downside, all cognitive understanding sometimes goes out the window and the emotional brain takes control.

One way of internalizing the potential fluctuation of an investment is to ask about its volatility. Specifically, it’s standard deviation. This measure of the amount of variation from the average is something an advisor can easily find out for almost every bond, stock, and mutual fund. Take the standard deviation times three, then subtract that number from the average return. This is the amount of value over one year your investment could drop (or rise) in 99% of all years. Stated conversely, there is only a 1% chance your investment would drop further in any one year.

  1. Portfolio Fit

I recently sent back a shirt that hung on me like a tent. While it would have been perfect for a larger guy, it was not a fit for me. Investments are similar. While some are perfect matches for one portfolio, they can be lethal in another. An over-allocation to emerging market stocks may make perfect sense for a newborn, but it could be a retirement disaster for a 90-year-old.

Pensive Financial Advisor for Physicians

Assessment

It’s important to ask why an investment belongs in your portfolio. You want investments (asset classes) that complement one another by tending to fluctuate independently of each other.

In an ideal balance of investments, when some decrease in value the other half increase an equal or greater amount, and all of them earn a real return over time.

Conclusion

Your thoughts and comments on this ME-P are appreciated. Feel free to review our top-left column, and top-right sidebar materials, links, URLs and related websites, too. Then, subscribe to the ME-P. It is fast, free and secure.

Speaker: If you need a moderator or speaker for an upcoming event, Dr. David E. Marcinko; MBA – Publisher-in-Chief of the Medical Executive-Post – is available for seminar or speaking engagements. Contact: MarcinkoAdvisors@msn.com

OUR OTHER PRINT BOOKS AND RELATED INFORMATION SOURCES:

 Comprehensive Financial Planning Strategies for Doctors and Advisors: Best Practices from Leading Consultants and Certified Medical Planners™

Is it Time to Reduce Your Bond Exposure?

Join Our Mailing List 

On Investment Portfolio Analysis

By Lon Jefferies MBA CFP®

Lon Jefferies

For the last half-decade, investors have been continually concerned about rising interest rates and the effect they may have on the bond portion of their investment portfolio.

The fear is that if interest rates rise, the bonds currently held by investors will be outdated and provide investment returns that are less than what new bonds issued at the higher yields would return.

Concerned?

There is validity to this concern – if an investor could buy a bond yielding 4% on the open market, why would anyone buy a bond that yields only 3%, unless they could do so at a significant discount? Given that today’s interest rates are considerably lower than historical averages and expected to rise in the future, would now be a good time to sell some of the bonds in your portfolio?

Consider the Timing

First, let’s consider one of the most basic principles of investing – that markets are unpredictable. Are we certain that interest rates will rise, and are we confident this rate increase will happen soon? I’d contend the answer to both questions is no.

Actually, the majority of investors have believed interest rates would rise since the first round of quantitative easing took place in 2009, and have suspected rates would rise in every calendar year since.  Quite simply, this has not happened. In fact, interest rates are currently lower than they were during the majority of 2009 despite five years of buzz about interest rate hikes.

During this five-year period, how have bonds performed? From 2009 through 2013, the Barclays Aggregate Bond Index (AGG) returned 5.93%, 6.54%, 7.84%, 4.22%, and -2.02%, respectively. Bonds only declined once during the five-year period, by a relatively nominal -2.02%, and still averaged a compound rate of return of 4.86%—not bad for the conservative portion of a portfolio.

Additionally, various bond categories have done even better than the Aggregate Bond Index, which consists of just U.S. government and corporate bond holdings. For instance, emerging market bonds (EMB) achieved a compounded return of 9.30%, while high yield bonds (HYG) returned 12.26% annually over the same five-year span. An investor whose bond portfolio was diversified among a range of asset categories has far from suffered since the expectation of a rate increases began.

Will You Miss the Stability of Bonds?

Let’s also consider the consistency of bonds. Since 1980, the Aggregate Bond Index has achieved a positive return an astonishing 31 out of 34 years (91% of the time!). Given this data, perhaps bonds aren’t as likely to decline in value as some investors think.

Equally amazing, although the bond index has achieved an annual return as high as 32.65% during this time period (in 1982), the largest loss it ever suffered in a calendar year over the same period was just -2.92% (in 1994). Over the entire 34-year period, the index obtained an average annual gain of 8.42%. Bottom line: Over the last 34 years, bonds have offered a lot of return for relatively little risk.

Diversification: the Most Important Factor

Not putting all your eggs in one basket is another basic principal of investing, and the primary motivation for having a significant portion of your portfolio allocated in bonds. It is important to remember that for an investor with a long-term perspective, equities will likely provide the majority of investment growth and return in a portfolio while bonds are needed to reduce volatility and risk.

For example, while a portfolio that was 100% stocks suffered a 38.6% loss in 2008, a portfolio that was 50% stocks and 50% bonds suffered a loss of only 14.5% the same year—still not pleasant, but much more manageable.

***

healthcare costs

***

Correlation

Bonds reduce risk in a portfolio because their return has a low correlation to the return of stocks. How low? Since 1928, both the S&P 500 and the 10-year treasury note have lost value during a calendar year only three times (in 1931, 1941 and 1969). That is less than 4% of all annual periods!

Further, since the Barclays Aggregate Bonds Index was created in 1973, the index has never decreased in value in the same year as the S&P 500. Amazing, but true! Clearly, bonds are fulfilling their role as a diversifier and reducing the volatility in your portfolio.

There is Always a Role for Bonds

Despite the continuous threat of rising interest rates, bonds have continued to perform. More importantly, history illustrates that mixing bonds with stocks smoothes out the investment results of your portfolio.

Assessment

Don’t get sucked in by the media buzz. Bonds are too valuable an asset to disregard.

The Author:

Lon Jefferies is a Certified Financial Planner with a fee-only approach to ensure the client’s best interest is the top priority. He isn’t paid commission and gains nothing through recommendations but his client’s satisfaction. He has contributed to national publications like The Wall Street Journal, The New York Times, USA Today, Morningstar.com and Investment News.   

Conclusion

Your thoughts and comments on this ME-P are appreciated. Feel free to review our top-left column, and top-right sidebar materials, links, URLs and related websites, too. Then, subscribe to the ME-P. It is fast, free and secure.

Speaker: If you need a moderator or speaker for an upcoming event, Dr. David E. Marcinko; MBA – Publisher-in-Chief of the Medical Executive-Post – is available for seminar or speaking engagements. Contact: MarcinkoAdvisors@msn.com

OUR OTHER PRINT BOOKS AND RELATED INFORMATION SOURCES:

Product Details  Product Details

Physician Creditor Protection for IRAs, Annuities and Insurance for 2014-15

Join Our Mailing List

A SPECIAL ME-P REPORT

###

Asset Protection Planning for Qualified and Non-Qualified Retirement Plans, IRAs, 403(b)s, Education IRAs (Coverdell ESAs), 529 Plans, UTMA Accounts, Health/Medical Savings Accounts (MSA/HSAs), Qualified and Non-Qualified Annuities, Long-Term Care Insurance, Disability Insurance and Group, Individual and Business Life Insurance [Ohio Focus]

By Edwin P. Morrow III; JD LLM MBA CFP® RFC®

[©2007-12-14. All rights reserved. USA]

EDITOR’S NOTE:

Hi Ann,

A couple years ago you posted an earlier version of the attached Asset Protection Outline. I updated it to include quite a bit more discussion of different protection levels for various kinds of accounts, and included more discussion of states other than Ohio, including a 50 state chart with IRA/403b protections.

So please delete the old one and replace with this one which contains more topics, including some substantial discussion of issues regarding current class action litigation jeopardizing asset protection for Schwab and Merrill Lynch IRAs.

Regards
Ed

###

The Importance of Asset Protection as Part of Financial and Estate Planning for Doctor’s and Medical Professionals

Asset Protection has become a ubiquitous buzz-word in the legal and financial community. It often means different things to different people. It may encompass anything from buying umbrella liability insurance to funding offshore trusts.

What is most likely to wipe out a client’s entire net worth? An investment scam, investment losses, a lawsuit, divorce or long-term health care expenses? “Asset Protection” may be construed to address all of these scenarios, but this outline will cover risk from non-spousal creditors as opposed to risk from bad investments, divorce, medical bills or excessive spending. Prudent business practice and limited liability entity use (LP, LLP, LLC, Corporation, etc) is the first line of defense against such risks. Similarly, good liability insurance and umbrella insurance coverage is paramount.

However, there is a palpable fear among many of frivolous lawsuits and rogue juries [especially among physicians and medical professionals]. Damages may exceed coverage limits. Moreover, insurance policies often have large gaps in coverage (e.g. intentional torts, “gross” negligence, asbestos or mold claims, sexual harassment).

As many doctors in Ohio know all too well, malpractice insurance companies can fail, too. Just as we advise clients regarding legal ways to legitimately avoid income and estate taxes or qualify for benefits, so we advise how to protect family assets from creditors. Ask your clients, “What level of asset protection do you want for yourself?

For the inheritance you leave to your family?” Do any clients answer “none” or “low”? Trusts that are mere beneficiary designation form or POD/TOD substitutes are going out of style in favor of “beneficiary-controlled trusts”, “inheritance trusts” and the like.

Table of Contents

While effort is made to ensure the material is accurate, this material is not intended as legal advice and no one may rely on it as such. Sections II(d), II(i), V, VI and XI were updated Feb 2012, but much of the material and citations have not been verified since 2010. Permission to reprint and share with fellow bar members is granted, but please contact author for updates if more than a year old.

T.O.C. [Page Number]

I. Importance of Asset Protection 2

II. State and Federal Protections Outside ERISA or Bankruptcy 4

a. Non-ERISA Qualified Plans: SEP, SIMPLE IRAs 5

b. Traditional and Roth IRAs, “Deemed IRAs” 7

c. Life Insurance 9

d. Long-Term Care, Accident/Disability Insurance 13

e. Non-Qualified Annuities 13

f. Education IRAs (now Coverdell ESAs) 16

g. 529 Plans 17

h. Miscellaneous State and Federal Benefits 18

i. HSAs, MSAs, FSAs, HRAs 18

III. Federal ERISA Protection Outside Bankruptcy 20

IV. Federal Bankruptcy Scheme of Creditor Protection 26

V. Non-Qualified Deferred Comp – Defying Easy Categorization 30

VI. Breaking the Plan – How Owners Can Lose Protection 32

(incl Prohibited Transactions and Schwab/Merrill Lynch IRA problems) 35

VII. Post-Mortem – Protections for a Decedent’s Estate 51

VIII. Post-Mortem – State Law Protections for Beneficiaries 52

IX. Post-Mortem – Bankruptcy Protections for Beneficiaries 54

X. Dangers and Advantages of Inheriting Through Trusts 56

XI. Piercing UTMA/UGMA and Other Third Party Created Trusts 59

XII. Exceptions for Spouses, Ex-Spouses and Dependents 61

XIII. Exceptions when the Federal Government (IRS) is Creditor 62

XIV. Fraudulent Transfer (UFTA) and Other Exceptions 68

XV. Disclaimer Issues – Why Ohio is Unique 69

XVI. Medicaid/Government Benefit Issues 71

XVII. Liability for Advisors 72

XVIII. Conflicts of Law – Multistate Issues 73

XIX. Conclusions 75

Appendices

A. Ohio exemptions – R.C. §2329.66 (excerpt), §3911.10, §3923.19 78

B. Bankruptcy exemptions – 11 U.S.C. § 522 excerpts 80

C. Florida IRA exemption – Fla Stat. § 222.21 (note-may be outdated) 85

D. Sal LaMendola’s Inherited IRA Win/Loss Case Chart 86

E. Multistate Statutory Debtor Exemption Chart 88

###

Assessment

This outline will discuss the sometimes substantial difference in legal treatment and protection for various investment vehicles and retirement accounts, with some further discussion of important issues to consider when trusts receive such assets.

Beware of general observations like: “retirement plans, insurance, IRAs and annuities are protected assets” – that may often be true, but Murphy’s law will make your client the exception to the general rules. The better part of this outline is pointing out those exceptions.

2012 WHITE PAPER LINK:

Creditor Protection for IRAs Annuities Insurance Nov 19 2010 WC CLE Feb 2012 update

***

2014 WHITE PAPER LINK UPDATE:

Optimal Basis Increase Trust Aug 2014

***

ABOUT THE AUTHOR:

Mr. Edwin P. Morrow III, a friend of the Medical Executive-Post, is a Wealth Specialist and Manager, Wealth Strategies Communications Ohio State Bar Association Certified Specialist, Estate Planning, Probate and Trust Law Key Private Bank Wealth Advisory Services. 10 W. Second St., 27th Floor Dayton, OH 45402. He is an ME-P “thought leader”.

Constructive criticism or other comments welcome.

Conclusion

Your thoughts and comments on this ME-P are appreciated. Feel free to review our top-left column, and top-right sidebar materials, links, URLs and related websites, too. Then, subscribe to the ME-P. It is fast, free and secure.

Speaker: If you need a moderator or speaker for an upcoming event, Dr. David E. Marcinko; MBA – Publisher-in-Chief of the Medical Executive-Post – is available for seminar or speaking engagements. Contact: MarcinkoAdvisors@msn.com

OUR OTHER PRINT BOOKS AND RELATED INFORMATION SOURCES:

Product Details  Product Details

Is it Fire Drill Time for Physician Investors?

Join Our Mailing List 

Catastrophes and “Black Swans” Happen

An ME-P Special Report

By Lon Jeffereis MBA CFP® CMP®

Lon JeffriesHistory tells us that over a long enough time span catastrophes are likely to occur. Fires, flooding, earthquakes – none can be prevented and all can be potentially devastating. While these events can’t always be avoided, we can prepare for these “black swans.”

Running practice fire drills enables us to act appropriately during misfortune while maintaining emergency food storage ensures we won’t starve when tragedy strikes.

Just as physical calamity can turn lives upside down, financial upheaval can lead to an unrecoverable loss. Fortunately, we have the ability to prepare for financial uncertainty in the same way we prepare for other exposures. As the current bull market is now both the fourth longest in history (64 months) and the fourth largest (+192% gain), now would be a perfect time to ensure you are prepared for the next market pullback.

Run a Portfolio Fire Drill

You can run a fire drill for your portfolio by understanding the loss potential of your holdings. It is critical to recognize that the amount of volatility your portfolio will experience in declining market environments is dependent on your asset allocation – how much of your account is invested in stocks vs. bonds. The larger the percentage of stocks in a portfolio, the more the portfolio’s value will increase during bull markets but decrease when the market declines. Let’s look at the historical performance and risk levels of a range of diversified stock-to-bond ratios:

Asset Allocation – Risk & Return (1970-2013)

***

Portfolio Allocation Average Annual Return Large Loss 08′
100% Stocks 10.85% -39%
80% Stocks20% Bonds 10.33% -30%
60% Stocks40% Bonds 9.99% -20%
50% Stocks50% Bonds 9.76% -15%
40% Stocks60% Bonds 9.49% -11%
20% Stocks80% Bonds 8.85% -4%

 ***

After determining the asset allocation of your portfolio, ask yourself how you would respond to another market correction like we experienced in 2008. For this exercise, considering loss in dollar terms is particularly productive. For instance, if 80% of your portfolio is invested in stocks, you might be able to convince yourself that you could sustain a 30% loss. However, supposing you have $500k invested, a 30% loss would mean your portfolio is suddenly depleted to $350k — $150k of hard earned money just evaporated. To many, the thought of losing $150k is more uncomfortable than the thought of a 30% loss.

Next, picture every media outlet sending warnings day after day about how the market is only going to get worse. Imagine yourself checking what the markets are doing multiple times a day and constantly being disappointed that it is another day of losses.

Lastly, visualize your occasional friend, neighbor or family member bragging about how he got out of the market before the collapse and telling you how you are a fool for not doing so.

***

Accidents Happen

[Accidents Happen]

How would you respond in such an environment? Would you have a hard time sleeping or digesting your food? It’s critical to be honest with yourself. If you would stray from your long-term investment strategy by selling after a market drop and waiting for the market to recover, your current portfolio may be too aggressive. If so, scale back the assertiveness of your portfolio by reducing your stock exposure now because selling stocks during a market decline is the last thing you want to do.

Sound financial planning suggests individuals should scale back the assertiveness of their portfolio as they approach retirement. While a young worker with 30 years until retirement can afford to be aggressive and has time to recover if a large loss in suffered, a person who is closer to retirement can’t afford to endure a significant loss right before the invested funds are needed to cover life expenses.

Maintain an Emergency Financial Storage

As stocks and bonds are the long-term portion of your investment portfolio, cash equivalents are your tool for dealing with short-term spending needs. Before even investing, everyone should have an emergency reserve holding enough cash to cover three to six months of expenses. These funds should only be tapped in the event of a job loss or a medical emergency.

Be Prepared

Additionally, investors who are taking withdrawals from their portfolio in order to meet cash flow needs should also have the equivalent of two years of necessary withdrawals in cash at all times. These funds should be used to cover living expenses during the next market correction. Having this emergency financial storage will prevent you from having to take withdrawals in a down market and allow your portfolio time to recover.

Assessment

No one knows when the next bear market will come. However, just like winter follows every fall, market corrections will ultimately come after every bull market.  Preparing for such a financial downturn will ensure you act appropriately when the time comes and prevent financial catastrophe.

BOOK: Comprehensive Financial Planning Strategies for Doctors and Advisors: Best Practices from Leading Consultants and Certified Medical Planners™

Conclusion

Your thoughts and comments on this ME-P are appreciated. Feel free to review our top-left column, and top-right sidebar materials, links, URLs and related websites, too. Then, subscribe to the ME-P. It is fast, free and secure.

Speaker: If you need a moderator or speaker for an upcoming event, Dr. David E. Marcinko; MBA – Publisher-in-Chief of the Medical Executive-Post – is available for seminar or speaking engagements. Contact: MarcinkoAdvisors@msn.com

OUR OTHER PRINT BOOKS AND RELATED INFORMATION SOURCES:

Product DetailsProduct DetailsProduct Details

Product Details  Product Details

 Financial Planning MDs 2015

BOOK:

Comprehensive Financial Planning Strategies for Doctors and Advisors: Best Practices from Leading Consultants and Certified Medical Planners™

A 2014 Stock Market Mid-Year Review

Join Our Mailing List 

What Do We Know?

[A SPECIAL R&D REPORT FOR THE ME-P]

By Lon Jefferies MBA CFP®

Lon JefferiesIf you pay close enough attention to the news media you’ll eventually learn that much emphasis is placed on pundits’ forecasts, but very little consideration is given to how accurate the projections turn out.

When 2014 started, there were some pretty widely-accepted expectations regarding the investment environment. Let’s take a minute to review those anticipations and analyze how precise they turned out to be.

Interest Rates

One of the most universally accepted beliefs going into 2014 was that interest rates were on the cusp of rising, and that consequently, bond returns would drop. (Of course, this has been the expectation for around five years now, but that is a discussion for a later time.) Investors were questioning whether they should reduce or eliminate the bond portion of their portfolios until the rate increase occurred.

So, have we experienced the rise in interest rates we were expecting? On 1/2/14, the yield on the 10-year Treasury note was 3%. As of 6/30/14, the yield on the same note was 2.516%.

That’s right — interest rates have actually decreased over the last six months. Did those who stuck with their investment strategies and maintained their bond positions experience a decline in their portfolio’s value?

Here is how a variation of different bonds have performed year-to-date (as of 6/30/14):

  • US Government Bonds (IEF): 4.89%
  • US TIPS (TIP): 5.25%
  • Corporate Bonds (LQD): 5.37%
  • International Bonds (IGOV): 5.66%
  • Emerging Market Bonds (LEMB): 6.42%

Equities

How about the equities side of the portfolio?

In January, predictions for stocks were all over the map — some predicted a full out correction (a loss of more than -20%), some predicted that we would keep chugging along at 2013′s pace, and most predicted something somewhere in between. There were, however, many factors that were a common cause of concern.

So, was the reduction of the Fed’s Quantitative Easing a legitimate fear? In fact, this possibility has come to fruition. In December, the Fed was buying $85 billion per month of financial assets from commercial banks and other private institutions. The Fed has reduced this monthly amount during every meeting it has held this year, and that amount is now down to $35 billion per month. However, the key question is what impact has this had on the stock market.

Here is how a wide basket of equities have performed year-to-date (as of 6/30/14):

The most widely accept fear among equity investors was the phasing out of the Fed’s Quantitative Easing (QE) program. Investors worried that the Fed would begin lowering the amount of loans the government would buy from commercial banks each month, which would lower the availability of capital in the economy.

Historically, less money in the system leads to less investing in new businesses, less innovation, and fewer jobs created.

  • Large Cap Stocks (IVV): 7.08%
  • Mid Cap Stocks (IJH): 7.57%
  • Small Cap Stocks (IJR): 3.30%
  • Foreign Stocks (IEFA): 4.34%
  • Emerging Markets (IEMG): 4.70%
  • Real Estate (IYR): 16.09%
  • Commodities (DJP): 7.32%
  • Gold (GLD): 10.27%

Volatility

The last widely-held viewpoint at the beginning of the year was that 2014 was likely to be a year more volatile than anything we had experience in 2012 or 2013. There was a lot of clatter about valuations and PE ratios being too high, concern about the war in Ukraine, a consensus that China was about to experience a drastic decline in both imports and exports, and a general feeling that the market was due for a significant (if not healthy) pullback.

Additionally, how much have we heard about unfavorable weather patterns over the last six months?

Managing a Stock Portfolio

Lessons Learned

Of course, all of this is not to say that interest rates will never rise, that bond values will never decline, and that the market won’t return to the roller coaster it is.

In fact, all those things are certain to happen. Unfortunately, anyone who contends to know the uncertain part of this equation — when — likely doesn’t actually know anymore than you or me. For this reason, having and sticking to a diversified investment strategy that coincides with a detailed financial plan is the most likely path to financial success.

The most significant lesson inherent in these numbers is that market expectations are essentially useless. Near the beginning of the year, the vast majority of experts anticipated interest rates to rise, bond values to drop, and volatility to increase. Unfortunately, pundits making projections are rarely held to their inaccurate forecasts and are allowed to continue making a living showing they have no greater knowledge than the average investor.

Assessment

So, has 2014 been a wild ride?

The S&P 500 dropped by -5.51% from 1/22/14 – 2/03/14, and by -3.89% from 4/2/14 – 4/11/14. These are the only declines of more than 2% that the S&P 500 has experienced all year!

Additionally, as of 6/30/14, the S&P 500 has now gone 54 consecutive trading days without an up or down move of greater than 1%, the longest stretch since 1995! By historical standards, 2014 is considered to be a very smooth ride.

More:

Stock Market at New Highs!

Conclusion

Your thoughts and comments on this ME-P are appreciated. Feel free to review our top-left column, and top-right sidebar materials, links, URLs and related websites, too. Then, subscribe to the ME-P. It is fast, free and secure.

Speaker: If you need a moderator or speaker for an upcoming event, Dr. David E. Marcinko; MBA – Publisher-in-Chief of the Medical Executive-Post – is available for seminar or speaking engagements. Contact: MarcinkoAdvisors@msn.com

OUR OTHER PRINT BOOKS AND RELATED INFORMATION SOURCES:

Product Details  Product Details

Product Details

Understanding Some Common Portfolio Payout Methods

   Certified Medical Planner

By Dr. David Edward Marcinko MBA CMP™

Recognizing the risk that market volatility represents to long-term portfolio health, investment accounts and endowment funds utilize a variety of methods to calculate periodic payouts.

  • Investment Yield: An investment portfolio using this method spends only its dividends and interest and re-invests any unrealized and realized gains. There would appear to be two primary disadvantages of this method. First, the payout amount will be extremely volatile as yields on equity and fixed income investments fluctuate. Second, the endowment manager could be encouraged to adopt a short-term focus on yield to the detriment of purchasing power preservation.
  • Percentage of the Prior Year’s Ending Market Value: An endowment using this method would withdraw some fixed percentage of the prior year’s market value. As with the Investment Yield method, disbursements from the endowment can be somewhat volatile under this method.
  • Moving Average: This approach, which is most common among educational institutions, generally involves taking a percentage of a moving average of the endowment market value. The percentage commonly approximates 5% over a 3-year period.
  • Inflation Adjusted: This portfolio method simply adds some factor to the applicable rate of inflation for the institution or investor.
  • Banded Inflation or Corridor: This account method is similar to the Inflation Adjusted method except that it establishes a corridor or band of minimum and maximum increases in an attempt to limit the volatility of the disbursement amounts.

payout

More:

Conclusion

Your thoughts and comments on this ME-P are appreciated. Feel free to review our top-left column, and top-right sidebar materials, links, URLs and related websites, too. Then, subscribe to the ME-P. It is fast, free and secure.

Speaker: If you need a moderator or speaker for an upcoming event, Dr. David E. Marcinko; MBA – Publisher-in-Chief of the Medical Executive-Post – is available for seminar or speaking engagements. Contact: MarcinkoAdvisors@msn.com

OUR OTHER PRINT BOOKS AND RELATED INFORMATION SOURCES:

Product Details  Product Details

Stock Market at New Highs!

Join Our Mailing List 

Is this a Bubble?

[A SPECIAL R&D REPORT FOR THE ME-P]

By David K. Luke MIM, MS-PFP, CMP™ [Certified Medical Planner™] http://www.networthadvice.com

David K. LukeThe market news has been replete with the phrase “new market high“ in the business news every couple of weeks as of late. The corresponding message is often that the stock market is likewise in a bubble. The S&P 500 index and the Dow Jones Industrial Average index are at all-time highs. The indexes have surpassed the 2007 peak.

The reality is however that the S&P 500 is up less than 6% from the beginning of the year, and the Dow is up about 2%. Most investors, of course, do not invest just in these two indexes, as these two indexes represent very large capitalized companies.

I am reminded of the customer in 1995 when I worked at a national brokerage firm that called me to liquidate his entire stock portfolio. “The stock market was too high,” he said. He was 5 years too early.

Risk Mitigation

Most investors will have a diversified portfolio that includes mid-cap stocks, small-cap stocks, and international stocks as well as large cap stocks such as found in the S&P 500.

Of course, these equity investments are also typically subdivided into the broader categories of “Growth” and “Value.” Which means most investors that believe in diversification will own four different “types” of stock, each divided into two different categories for eight different baskets of stock if you will. The typical daily news will focus only perhaps on the S&P 500, which is a portfolio of large capitalized growth stocks. This is only one of the eight different types of stock that an investor would typically own.

  Product Details

In strong bull markets, typically all eight categories of stock go up together with some degree of correlation. This is also true in strong bear markets with all eight categories of stock going down in some degree of correlation. Portfolio managers typically try to offset high correlation of investments by owning investments in asset classes that typically do not all correlate together. This is a major technique used to reduce the volatility in an account.

However as you can see so far this year, most all of the eight stock indexes with the exception of small-cap growth are up slightly in line with the S&P index.

***

[As of June 13, 2014] 

Name Ticker % Total Return YTD % Total Return 12 Month
Large Cap iShares S&P 500 Growth IVW 5.59 22.55
iShares S&P 500 Value IVE 5.76 18.39
Mid Cap iShares S&P MidCap 400 Growth IJK 2.69 18.24
iShares S&P Mid-Cap 400 Value IJJ 7.66 23.19
Small Cap iShares S&P Small-Cap 600 Growth IJT -0.52 20.8
iShares S&P Small-Cap 600 Value IJS 2.3 21.37
Foreign Large Blend iShares Core MSCI EAFE IEFA 3.75 19.25
Barclays Aggregate Bond Index iShares Core US Aggregate Bond AGG 3.26 2.39

Source: Morningstar

***

Inflation

The buying power of the US Dollar has changed over the years. The Consumer Price Index (CPI), a common measure of inflation, has averaged around a 3% annual increase from 1913 – 2014 according to the U.S. Department of Labor Bureau of Labor Statistics.

In fact, an item purchased for $5.00 in 1913 would have a cost of $119.73 today, or a cumulative rate of inflation for the past 100 years of 2,294.7%. The cost of living rising each year is a safe bet. Inflation has increased every year in the past 50 years with one exception: 2009 when inflation fell -0.4%.

Product Details

Update: 06/17/2014 04:10 ET

[Market Update]
Symbol Last Change
DOW 16,808.49 +27.48
NASDAQ 4,337.23 +16.13
S&P 1,941.99 +4.21

Conclusions:

  1. The Market Indexes at new highs does not indicate a bubble. In fact, the market should, relatively speaking, regularly be hitting new highs because of the consistency of positive inflation. Prices of goods and services today are at all-time highs. Does that mean we are in an “inflation” bubble? No. This is normal.
  2. The S&P 500 is not an accurate measure of the US economy. While the S&P 500 is the common “market” indicator in the US, only about 55% of the earnings of the index come from the US. (Source: RBC Capital Markets Research, Capital IQ 2012). This is because mainly large multinational companies such as Google, IBM, and Apple that have a significant amount of overseas revenues weight the index.
  3. The S&P 500 or the Dow Jones Industrial Average (DJIA – 30 stocks) is most likely not an exact reflection of your personal stock portfolio, which would expectantly be more diversified. A typical well-diversified long-term investment portfolio would include not just large cap stocks (such as found in the S&P 500 or DJIA), but mid, small, and international stocks from the growth and value camp, as well as a diversified bond holding.
  4. Overpriced stocks, just like overpriced real estate, are more prudently ascertained by value measures, not simply by raw index numbers. A stock hitting new highs could still be quite undervalued. Meaningful variables such as earnings growth, price to earnings ratio, dividend yield, price-to-book, price-to-sales, and other metrics should be considered.

Conclusion

Your thoughts and comments on this ME-P are appreciated. Feel free to review our top-left column, and top-right sidebar materials, links, URLs and related websites, too. Then, subscribe to the ME-P. It is fast, free and secure.

Speaker: If you need a moderator or speaker for an upcoming event, Dr. David E. Marcinko; MBA – Publisher-in-Chief of the Medical Executive-Post – is available for seminar or speaking engagements. Contact: MarcinkoAdvisors@msn.com

OUR OTHER PRINT BOOKS AND RELATED INFORMATION SOURCES:

Product DetailsProduct Details

Two Healthcare Sectors the Stock Market Got Wrong on Election Day 2012

Join Our Mailing List

How various sectors in the Health Care Industry fared under the PP-ACA legislation?

[A SPECIAL R&D REPORT FOR THE ME-P]

By David K. Luke MIM, MS-PFP, CMP™ [Certified Medical Planner™]

Website: http://www.networthadvice.com

David K. LukeThere has been a lot of speculation since the words “Affordable Care Act” were first whispered years ago on how the various sectors in the Health Care Industry would fare under such legislation. I proposed that a good indicator would be to look at the performance of the individual health care sector stocks on the first trading day after the election.

(See With Obama Election Win, “Mr. Market” Weighs in on the ACA Equity Winners and Losers by David K. Luke on November 16, 2012).

Link: With Obama Election Win “Mr. Market” Weighs in on the ACA Equity Winners and Losers

The day after Pres. Obama’s reelection on Wednesday, November 7, 2012 the stock market was down over 2% as measured by the S&P 500 and the Dow Jones Industrial Average (DJIA). The common reason given was increased doubt that the impending “fiscal cliff” issue, which was splitting the House and the Senate, would be resolved. There was however, another big concern on investor’s mind: the future of the Affordable Care Act. While the election was close when measured by the popular vote with President Obama earning 51.06% versus Mitt Romney with 47.20%, the electoral vote showed a hands-down Obama victory with 332 versus 206 votes. Investors voted with their pocketbooks with that first trading session following the election showing certain healthcare sectors up in price, other healthcare sectors with moderate returns, and certain healthcare sectors down in price.

Disparate Health Care Sector Returns

It is interesting to look back now over a year and a half later and see how accurate those investor votes were on that first day of realization that health care reform was continuing forward at a much faster pace now that President Obama would be serving a second term. Keeping in mind that the day was a very negative day as a whole in the stock market, a number of healthcare sectors were up in price. This group includes Hospital Stocks and Medicaid HMOs. Note the phenomenal one-day returns (in a down 2% market!) on the sample stocks in these two groups:

Hospital Stocks

  • Health Management Associates (HMA) +7.3%
  • HCA Holdings Inc. (HCA) +9.4%
  • Community Health Systems Inc. (CYH) +6.0%
  • Tenet Healthcare Corp. (THC) +9.6%

Medicaid HMOs

  • Molina Healthcare Inc. (MOH) +4.6%
  • Centene Corp. (CNC) +10.1%
  • WellCare Health Plans Inc. (WCG) +4.4%

Such positive returns on a big down day in the market indicates investors assessing these healthcare sectors being good investments under an Obama presidency and a positive outlook for the implementation of the Affordable Care Act. The other up sector on that day was the Drug Wholesalers, up almost 1% on that negative day. (See “Selected Health Care Performance” Chart – below).

The market had a tepid response to the Pharmacy Benefit sector, as well as the Generic Pharmacy, Testing Labs, and Big Pharma. In my sample group, these sectors were down -.4%, -7%, -1.7%, and -1.4% respectively. It is important to note however that these sectors while slightly positive or barely negative still performed better than the general market that day.

Two Sectors

But, the two healthcare sectors that the stock market severely punished with the voting of substantially more sellers than buyers by investors on that first post-election day were the Medical Device Companies (down 2.5% in the sample group) and the Medicare Part D Companies (down 4.7% in the sample group). The thought at the time was that Medical Device Companies, facing an impending medical device excise tax of 2.3% on the sale of most medical devices in the United States, would be devastated, and that Medicare Part D Companies would face severe profit constraints with tighter-fisted government regulations imposed by the ACA.

***

Stock_Market

***

The Retro-Specto-Scope

In hindsight, investors were correct on two out of the three predictions based on stock market prices on the various healthcare sectors. Hospital Stocks, Medicaid HMOs, and Drug Wholesalers, the leading sectors indicated to be winners with the impending implementation of the ACA, are up 69.8%, 63.6% and 76.5% respectively in the sample groups since November 7, 2012. This remarkable and closely parallel return for these three sectors seemed to prove that the stock market on November 7, 2012 correctly picked the three winning health care sectors! The S&P 500 index for the same time is up 32.02%, a nice return for 1 ½ years but about half the return of these apparently huge benefactors of the ACA. The healthcare sectors that investors felt less positive about (but more positive than the general stock market) on that first postelection day were Pharmacy Benefit Companies, Generic Pharmacy Companies, Testing Labs, and Big Pharma. These four health care sectors are up 43.8%, 40.5%, 6.4%, and 20.5% respectively. Again, in terms of ranking the sectors, these four sectors performed in line based on the comparative returns of the other healthcare sectors.

Wisdom of Crowds

Amazingly, it appears that the emotional Mr. Market predicated quite accurately on Wednesday, November 7, 2012, in one day of trading, not just which health sectors would be good investments for the near future, but the actually ranking of the future performance of the sectors! It seems as though the stock market, as one large voting machine, precisely dissected the over 20,000 pages + of resulting legislation created from the original 906 pages (pdf here) of the PPACA law and distilled it down to profits and losses with the resulting winners and losers in the health care industry in one trading session.

Two [2] Big Misses

Investors however were way off on their concerns about Medical Device Companies and Medicare Part D Companies. The two sample groups were up 71.3% and 66.4% in the time of November 7, 2012 to May 19, 2014 respectively, more than double the S&P 500 for the same period, and in line with the best performing sectors! This is spite of the fact that stock sample of these two groups were the two worst performers on post-election day trading. What happened?

***

Bear + A Falling Stock Chart

***

The “Medical Device Excise Tax” Fable and the “Private Insurers Will Control Costs” Fairy Tale

Wall Street has sharpened their pencils in the last year and a half and realized they have gravely underestimated the profit potential of the Medical Device makers and the Managed Care Health Insurers, in spite of the ACA. Based on stock price performance of the sample group of major players in the past 18 months, fewer sectors look as profitable as the Medical Device Industry and the Medicare Part D Industry. What happened?

The Medical Device industry states that the tax will cost the US “tens of thousands of jobs” and that those jobs will be shipped overseas. A number of issues that are involved here however refute these claims (http://www.factcheck.org/2013/10/boehner-and-the-medical-device-tax/. It appears that any targeted reductions were not related to the implementation of the tax, which became effective January 1, 2013, in spite of heavy protest by the industry. Medical technology continues to have a bright future regardless of the tax.

The notion that the “Affordable” Care Act will help reign in the rampant cost increases of Medicare’s “Part D” program seem to be elusive. Private insurers have done a poor job of keeping drug prices down, especially when compared to the discounts the government gets for Medicaid. Medicare Part D companies wield significant influence on Capitol Hill, and impending steeper discounts look unlikely.

Everybody Wins, Except …

Before the ACA implementation, about 85% of Americans had health insurance. Currently with an additional 7 million Americans with health insurance thanks to Obamacare, an additional 2.2% of Americans now have coverage, or about 87% of all Americans. How can such a slight increase in new health care consumers be responsible for such large anticipated profits in the health care sector? It cannot. Wall Street is telling us that the new health law is not about new customers, but about increased profit margins for the health care industry. I can draw three conclusions:

  1. The Affordable Care Act may not be so affordable for health consumers
  2. Most companies in the Health Care Industry stand to gain financially with ACA. There is one sure loser with ACA: The physician, who can only look forward to increased workloads and mpending Medicare SGR pay cuts.

THE CHART [Research and Development]

Selected Health Care Sector Stock Performance Random Sampling of Publically Traded Companies From President Obama Re-election Date to Present

Chart

Conclusion

Your thoughts and comments on this ME-P are appreciated. Feel free to review our top-left column, and top-right sidebar materials, links, URLs and related websites, too. Then, subscribe to the ME-P. It is fast, free and secure.

Link: http://feeds.feedburner.com/HealthcareFinancialsthePostForcxos

Speaker: If you need a moderator or speaker for an upcoming event, Dr. David E. Marcinko; MBA – Publisher-in-Chief of the Medical Executive-Post – is available for seminar or speaking engagements. Contact: MarcinkoAdvisors@msn.com

OUR OTHER PRINT BOOKS AND RELATED INFORMATION SOURCES:

Product DetailsProduct DetailsProduct Details

Product DetailsProduct Details

Product Details  Product Details

Product Details

How Much is a Financial Advisor Really Worth?

Join Our Mailing List

And … Can it be Quantified?

Doctors and FAs

[By Staff Reporters]

How much of a boost in net returns can financial advisors add to client portfolios? According to Vanguard Brokerage Services®; maybe as much as 3%?

The Study

In a recent paper from the Valley Forge, PA based mutual fund and ETF giant, Vanguard said financial advisors can generate returns through a framework focused on five wealth management principles:

Being an effective behavioral coach: Helping clients maintain a long-term perspective and a disciplined approach is arguably one of the most important elements of financial advice. (Potential value added: up to 1.50%).

Applying an asset location strategy: The allocation of assets between taxable and tax-advantaged accounts is one tool an advisor can employ that can add value each year. (Potential value added: from 0% to 0.75%).

Employing cost-effective investments: This component of every advisor’s tool kit is based on simple math: Gross return less costs equals net return. (Potential value added: up to 0.45%).

Maintaining the proper allocation through rebalancing: Over time, as investments produce various returns, a portfolio will likely drift from its target allocation. An advisor can add value by ensuring the portfolio’s risk/return characteristics stay consistent with a client’s preferences. (Potential value added: up to 0.35%).

Implementing a spending strategy: As the retiree population grows, an advisor can help clients make important decisions about how to spend from their portfolios. (Potential value added: up to 0.70%).

Source: Financial Advisor Magazine, page 20, April 2014.

networking advisors

The Fine-Print

But, Vanguard notes that while it’s possible all of these principles could add up to 3% in net returns for clients, it’s more likely to be an intermittent number than an annual one because some of the best opportunities to add value happen during extreme market lows and highs when angst or giddiness [fear and greed] can cause investors to bail on their well-thought-out investment plans.

More: http://www.CertifiedMedicalPlanner.org

Assessment

Most retail financial services products are designed to enhance the well-being of the Financial Advisor and/or vendor at the expense of clients. The clients get only the leftovers. Of course, no one tells them that secret. They have to figure it out for themselves. As the old line goes, “Where are the customers’ boats?”

Source: Rowland, M: Planning Periscope [Where Advisors are the Clients]. Financial Advisors Magazine; page 36, April 2014

Conclusion

Are doctors different than the average investors noted in this essay?

Your thoughts and comments on this ME-P are appreciated. Feel free to review our top-left column, and top-right sidebar materials, links, URLs and related websites, too. Then, subscribe to the ME-P. It is fast, free and secure.

Link: http://feeds.feedburner.com/HealthcareFinancialsthePostForcxos

Speaker: If you need a moderator or speaker for an upcoming event, Dr. David E. Marcinko; MBA – Publisher-in-Chief of the Medical Executive-Post – is available for seminar or speaking engagements. Contact: MarcinkoAdvisors@msn.com

OUR OTHER PRINT BOOKS AND RELATED INFORMATION SOURCES:

Product Details  Product Details

Risk Management, Liability Insurance, and Asset Protection Strategies for Doctors and Advisors: Best Practices from Leading Consultants and Certified Medical Planners™8Comprehensive Financial Planning Strategies for Doctors and Advisors: Best Practices from Leading Consultants and Certified Medical Planners™

***

Understanding Average [Physician] Investor Results

Join Our Mailing List 

On the failure of the average investors to keep up with investment markets

[By Lon Jefferies MBA CFP® http://www.NetWorthAdvice.com]

The following chart was recently published by Bob Doll at Nuveen Investments:

investor-results

Epic Failure

Doll attributes the failure of the average investor to keep up with investment markets (or even inflation, for that matter) to market timing and emotionally driven decisions to move into and out of the market.

The Data

How long has it been supposedly common knowledge that investors are better off choosing an investment strategy that represents their risk tolerance and sticking to it both in the good times and bad? Still, this data illustrates that investors are terrible at sticking to their strategy when markets stall, and still have an overwhelming urge to buy after the market has already done well and sell shortly after a market drop (i.e. buy high and sell low).

A Financial Plan

Again, having a defined, documented investment strategy can help you avoid the types of behavior that cause other investors to significantly under-perform the market. This is where having a written financial plan can be invaluable.

Assessment

Of course, working with a financial advisor with a history of executing a steady, buy-and-hold approach can provide important support in avoiding detrimental behaviors during the rough times.

Conclusion

Are doctors different than the average investor noted in this essay?

Your thoughts and comments on this ME-P are appreciated. Feel free to review our top-left column, and top-right sidebar materials, links, URLs and related websites, too. Then, subscribe to the ME-P. It is fast, free and secure.

Link: http://feeds.feedburner.com/HealthcareFinancialsthePostForcxos

Speaker: If you need a moderator or speaker for an upcoming event, Dr. David E. Marcinko; MBA – Publisher-in-Chief of the Medical Executive-Post – is available for seminar or speaking engagements. Contact: MarcinkoAdvisors@msn.com

OUR OTHER PRINT BOOKS AND RELATED INFORMATION SOURCES:

Product Details  Product Details