BOARD CERTIFICATION EXAM STUDY GUIDES Lower Extremity Trauma
[Click on Image to Enlarge]
ME-P Free Advertising Consultation
The “Medical Executive-Post” is about connecting doctors, health care executives and modern consulting advisors. It’s about free-enterprise, business, practice, policy, personal financial planning and wealth building capitalism. We have an attitude that’s independent, outspoken, intelligent and so Next-Gen; often edgy, usually controversial. And, our consultants “got fly”, just like U. Read it! Write it! Post it! “Medical Executive-Post”. Call or email us for your FREE advertising and sales consultation TODAY [678.779.8597] Email: MarcinkoAdvisors@outlook.com
Medical & Surgical e-Consent Forms
ePodiatryConsentForms.com
iMBA Inc., OFFICES
Suite #5901 Wilbanks Drive, Norcross, Georgia, 30092 USA [1.678.779.8597]. Our location is real and we are now virtually enabled to assist new long distance clients and out-of-town colleagues.
ME-P Publishing
SEEKING INDUSTRY INFO PARTNERS?
If you want the opportunity to work with leading health care industry insiders, innovators and watchers, the “ME-P” may be right for you? We are unbiased and operate at the nexus of theoretical and applied R&D. Collaborate with us and you’ll put your brand in front of a smart & tightly focused demographic; one at the forefront of our emerging healthcare free marketplace of informed and professional “movers and shakers.” Our Ad Rate Card is available upon request [678-779-8597].
Posted on October 14, 2025 by Dr. David Edward Marcinko MBA MEd CMP™
ByAI and Staff Reporters
***
***
Alpha Male and Beta Male are terms for men derived from the designations of alpha and beta animals in ethology. They may also be used with other genders, such as women, or additionally use other letters of the Greek alphabet (such as sigma. The popularization of these terms to describe humans has been widely criticized by scientists. Both terms have been frequently used in internet memes.
The term beta is used as a pejorative self-identifier among some members of the manosphere, particularly incels, who do not believe they are assertive and/or traditionally masculine, and feel overlooked by women. It is also used to negatively describe other men who are not deemed to be assertive, particularly with women. In internet culture, the term sigma male is also frequently used, gaining popularity in the late 2010s, but has since been used jokingly, often being used with incel.
Note: Incel is a portmateau of “involuntary celibate”) is a term associated with an online subculture of mostly male and heterosexual people who define themselves as unable to find a romantic or sexual despite desiring one. They often blame, objectify and denigrate women and girls as a result.
Delta Males are very responsible and keep the world moving. Highly adaptable, deltas are known for their competence and work ethic rather than their leadership and ambition. Delta Males love learning new skills for the sake of improving themselves, not for power or extrinsic successes. Because of this, they often have a very healthy work-life balance. They’re dependable and unpretentious. Common personality traits: hardworking, loyal and responsible. Careers they excel at are accountant, dentist, engineer and firefighter. If you’re a delta male, your work often speaks for itself. People trust you, so consider being more proactive and taking initiative at work; you’ll be rewarded for it and won’t necessarily need to be in the spotlight.
Gammas Males tend to be insecure about status and may overestimate their status. They’re unhappy with their position, so they try to convince themselves that they’re Sigmas. A Gamma Male is described as intelligent, romantic, and empathetic. While he has some female traits, he has difficulty understanding and dating women. But, unlike alphas, gammas avoid conflict at all costs and care deeply about what other people think of them. They lack the leadership skills and confidence to be on top.
Omega Males are skilled introverts who don’t need external validation. Pop culture portrays them as the shyer, more reserved yin to the zeta male’s yang. They’re independent and very comfortable in their own company. They’d rather spend time coming up with (usually brilliant) new ideas and inventions of their own instead of socializing with others. They have uncouth but delightful senses of humor and their theories often change the world for the better. Common personality traits are self-motivated, strategic and quiet. Careers they excel at are chemist, composer, inventor and mathematician. If you’re an omega male, your ideas are likely ingenious.
Sigma Males are rebellious leaders with lots of life experience while delta males are responsible companions who you want by your side.Common personality traits are nurturing and wise. Careers they excel at areentrepreneur, philosopher, professor, or therapist.
Zeta Males are one-of-a-kind progressives. There’s a reason the zeta male is the least talked about personality type in pop culture. They’re rare nonconformists who don’t care what other people think. They know themselves and refuse to change to fit into the rigid social standards of society. Zeta males are fierce creatives who blaze new paths for themselves and others. Zeta Males are nonconformist creatives, gamma males are charismatic nomads, and omega males are sharp intellectuals with boundless ideas. Careers they excel at are actor, artist, musician or writer. Common personality traits are creative, independent and self-aware.
QUESTION: Doctors, Agents, Accountants and Financial Advisors: What is your male personality type?
According to Wayne Firebaugh CPA, CFP®, CMP™ alpha measures non-systematic return on investment [ROI], or the return that cannot be attributed to the market.
It shows the difference between a fund’s actual return and its expected performance given the level of systematic (or market) risk (as measured by beta).
Example
For example, a fund with a beta of 1.2 in a market that returns 10% would be expected to earn 12%. If, in fact, the fund earns a return of 14%, it then has an alpha of 2 which would suggest that the manager has added value. Conversely, a return below that expected given the fund’s beta would suggest that the manager diminished value.
In a truly efficient market, no manager should be able to consistently generate positive alpha. In such a market, the endowment manager would likely employ a passive strategy that seeks to replicate index returns. Although there is substantial evidence of efficient domestic markets, there is also evidence to suggest that certain managers do repeat their positive alpha performance.
In fact, a 2002 study by Roger Ibbotson and Amita Patel found that “the phenomenon of persistence does exist in domestic equity funds.” The same study suggested that 65% of mutual funds with the highest style-adjusted alpha repeated with positive alpha performances in the following year.
More Research
Additional research suggests that active management can add value and achieve positive alpha in concentrated portfolios.
A pre 2008 crash study of actively managed mutual funds found that “on average, higher industry concentration improves the performance of the funds. The most concentrated funds generate, after adjusting for risk … the highest performance. They yield an average abnormal return [alpha] of 2.56% per year before deducting expenses and 1.12% per year after deducting expenses.”
FutureMetrics
FutureMetrics, a pension plan consulting firm, calculated that in 2006 the median pension fund achieved record alpha of 3.7% compared to a 60/40 benchmark portfolio, the best since the firm began calculating return data in 1988. Over longer periods of time, an endowment manager’s ability to achieve positive alpha for their entire portfolio is more hotly debated. Dimensional Fund Advisors, a mutual fund firm specializing in a unique form of passive management, compiled FutureMetrics data on 192 pension funds for the period of 1988 through 2005.
Their research showed that over this period of time approximately 75% of the pension funds underperformed the 60/40 benchmark. The end result is that many endowments will use a combination of active and passive management approaches with respect to some portion of the domestic equity segment of their allocation.
Assessment
One approach is known as the “core and satellite” method in which a “core” investment into a passive index is used to capture the broader market’s performance while concentrated satellite positions are taken in an attempt to “capture” alpha. Since other asset classes such as private equity, foreign equity, and real assets are often viewed to be less efficient, the endowment manager will typically use active management to obtain positive alpha from these segments.
Notes:
Ibbotson, R.G. and Patel, A.K. Do Winners Repeat with Style? Summary of Findings – Ibbotson & Associates, Chicago (February 2002).
Kacperczyk, M.T., Sialm, C., and Lu Zheng. On Industry Concentration of Actively Managed Equity Mutual Funds. University of Michigan Business School. (November 2002).
2007 Annual US Corporate Pension Plan Best and Worst Investment Performance Report. FutureMetrics, April 20, 2007.
Conclusion
Your thoughts and comments on this ME-P are appreciated. Feel free to review our top-left column, and top-right sidebar materials, links, URLs and related websites, too. Then, subscribe to the ME-P. It is fast, free and secure.
Speaker: If you need a moderator or speaker for an upcoming event, Dr. David E. Marcinko; MBA – Publisher-in-Chief of the Medical Executive-Post – is available for seminar or speaking engagements. Contact: MarcinkoAdvisors@outlook.com
OUR OTHER PRINT BOOKS AND RELATED INFORMATION SOURCES:
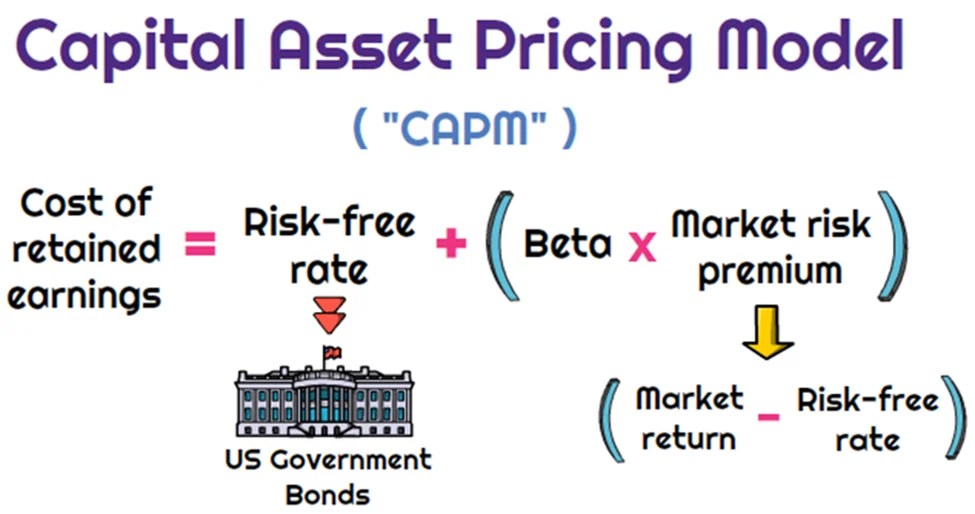
Dr. Harry Markowitz is credited with developing the framework for constructing investment portfolios based on the risk-return tradeoff. William Sharpe, John Lintner, and Jan Mossin are credited with developing the Capital Asset Pricing Model (CAPM).
CAPM is an economic model based upon the idea that there is a single portfolio representing all investments (i.e., the market portfolio) at the point of the optimal portfolio on the Capital Market Line (CML) and a single source of systematic risk, beta, to that market portfolio. The resulting conclusion is that there should be a “fair” return investors should expect to receive given the level of risk (beta) they are willing to assume.
The excess return, or return above the risk-free rate, that may be expected from an asset is equal to the risk-free return plus the excess return of the market portfolio times the sensitivity of the asset’s excess return to the market portfolio excess return. Beta, then, is a measure of the sensitivity of an asset’s returns to the market as a whole. A particular security’s beta depends on the volatility of the individual security’s returns relative to the volatility of the market’s returns, as well as the correlation between the security’s returns and the markets returns.
While a stock may have significantly greater volatility than the market, if that stock’s returns are not highly correlated with the returns of the overall market (i.e., the stock’s returns are independent of the overall market’s returns), then the stock’s beta would be relatively low. A beta in excess of 1.0 implies that the security is more exposed to systematic risk than the overall market portfolio, and likewise, a beta of less 1.0 means that the security has less exposure to systematic risk than the overall market.
MPT has helped focus investors on two extremely critical elements of investing that are central to successful investment strategies.
First, MPT offers the first framework for investors to build a diversified portfolio. Furthermore, an important conclusion that can be drawn from MPT is that diversification does in fact help reduce portfolio risk.
Thus, MPT approaches are generally consistent with the first investment rule of thumb, “understand and diversify risk to the extent possible.”
Additionally, the risk/return tradeoff (i.e., higher returns are generally consistent with higher risk) central to MPT based strategies has helped investors recognize that if it looks too good to be true, it probably is.
Passive Investing
Passive investing is a monetary plan in which an investor invests in accordance with a pre-determined strategy that doesn’t necessitate any forecasting of the economy or an individual company’s prospects. The primary premise is to minimize investing fees and to avoid the unpleasant consequences of failing to correctly predict the future. The most accepted method to invest passively is to mimic the performance of a particular index. Investors typically do this today by purchasing one or more ‘index funds’. By tracking an index, an investor will achieve solid diversification with low expenses.
An ivestor could potentially earn a higher rate of return than an investor paying higher management fees. Passive management is most widespread in the stock markets. But with the explosion of exchange traded funds on the major exchanges, index investing has become more popular in other categories of investing. There are now literally hundreds of different index funds.
Passive management is based upon the Efficient Market Hypothesis theory. The Efficient Market Hypothesis (EMH) states that securities are fairly priced based on information regarding their underlying cash flows and that investors should not anticipate to consistently out-perform the market over the long-term.
The Efficient Market Hypothesis evolved in the 1960s from the Ph.D. dissertation of Eugene Fama. Fama persuasively made the case that in an active market that includes many well-informed and intelligent investors, securities will be appropriately priced and reflect all available information. If a market is efficient, no information or analysis can be expected to result in out-performance of an appropriate benchmark. There are three distinct forms of EMH that vary by the type of information that is reflected in a security’s price:
Weak Form
This form holds that investors will not be able to use historical data to earn superior returns on a consistent basis. In other words, the financial markets price securities in a manner that fully reflects all information contained in past prices.
Semi-Strong Form
This form asserts that security prices fully reflect all publicly available information. Therefore, investors cannot consistently earn above normal returns based solely on publicly available information, such as earnings, dividend, and sales data.
Strong Form
This form states that the financial markets price securities such that, all information (public and non-public) is fully reflected in the securities price; investors should not expect to earn superior returns on a consistent basis, no matter what insight or research they may bring to the table.
While a rich literature has been established regarding whether EMH actually applies in any of its three forms in real world markets, probably the most difficult evidence to overcome for backers of EMH is the existence of a vibrant money management and mutual fund industry charging value-added fees for their services.
The notion of passive management is counterintuitive to many investors. Passive investing proponents follow the strong market theory of EMH. These proponents argue several points including;
In the long term, the average investor will have a typical before-costs performance equal to the market average. Therefore the standard investor will gain more from reducing investment costs than from attempting to beat the market over time.
The efficient-market hypothesis argues that equilibrium market prices fully reflect all existing market information. Even in the case where some of the market information is not currently reflected in the price level, EMH indicates that an individual investor still cannot make use of that information. It is widely interpreted by many academics that to try and systematically “beat the market” through active management is a fools game.
Not everyone believes in the efficient market. Numerous researchers over the previous decades have found stock market anomalies that indicate a contradiction with the hypothesis. The search for anomalies is effectively the hunt for market patterns that can be utilized to outperform passive strategies. Such stock market anomalies that have been proven to go against the findings of the EMH theory include;
Low Price to Book Effect
January Effect
The Size Effect
Insider Transaction Effect
The Value Line Effect
All the above anomalies have been proven over time to outperform the market. For example, the first anomaly listed above is the Low Price to Book Effect. The first and most discussed study on the performance of low price to book value stocks was by Dr. Eugene Fama and Dr. Kenneth R. French. The study covered the time period from 1963-1990 and included nearly all the stocks on the NYSE, AMEX and NASDAQ. The stocks were divided into ten subgroups by book/market and were re-ranked annually. In the study, Fama and French found that the lowest book/market stocks outperformed the highest book/market stocks by a substantial margin (21.4 percent vs. 8 percent). Remarkably, as they examined each upward decile, performance for that decile was below that of the higher book value decile. Fama and French also ordered the deciles by beta (measure of systematic risk) and found that the stocks with the lowest book value also had the lowest risk.
Today, most researchers now deem that “value” represents a hazard feature that investors are compensated for over time. The theory being that value stocks trading at very low price book ratios are inherently risky, thus investors are simply compensated with higher returns in exchange for taking the risk of investing in these value stocks. The Fama and French research has been confirmed through several additional studies. In a Forbes Magazine 5/6/96 column titled “Ben Graham was right–again,” author David Dreman published his data from the largest 1500 stocks on Compustat for the 25 years ending 1994. He found that the lowest 20 percent of price/book stocks appreciably outperformed the market.
One item a medical professional should be aware of is the strong paradox of the efficient market theory. If each investor believes the stock market were efficient, then all investors would give up analyzing and forecasting. All investors would then accept passive management and invest in index funds. But if this were to happen, the market would no longer be efficient because no one would be scrutinizing the markets. In actuality, the efficient market hypothesis actually depends on active investors attempting to outperform the market through diligent research.
The case for passive investing and in favor of the EMH is that a preponderance of active managers do actually underperform the markets over time. The latest study by Standard and Poor’s (S&P) confirms this fact. S&P recently compared the performance of actively-managed mutual funds to passive market indexes twice per year. The 2012 S&P study indicated that indexes were once again outperforming actively-managed funds in nearly every asset class, style and fund category. The lone exception in the 2012 report was international equity, where active outperformed the index that S&P chose. The study examined one-year, three-year and five-year time periods. Within the U.S. equity space, active equity managers in all the categories failed to outperform the corresponding benchmarks in the past five year period. More than 65 percent of the large-cap active managers lagged behind the S&P 500 stock index. More than 81 percent of mid-cap mutual funds were outperformed by the S&P MidCap 400 index.
Lastly, 77 percent of the small-cap mutual funds were outperformed by the S&P SmallCap 600 index. U.S. bond active managers fared no better that equity managers over a five year period. More than 83 percent of general municipal mutual funds under-performed the S&P National AMT-Free Municipal Bond index, 93 percent of government long-term funds under-performed the Barclays Long Government index, nearly 95 percent of high yield corporate bond funds under-performed the Barclays High Yield index. Although the performance measurements for index investing are very strong, many analysts find three negative elements of passive investing;
Downside Protection: When the stock market collapses like in 2008, an index investor will assume the same loss as the market. In the case of 2008, the S&P 500 stock index fell by more than 50 percent, offering index investors no downside protection.
Portfolio Control: An index investor has no control over the holdings in the fund. In the event that a certain sector becomes over-owned (i.e. technology stocks in 2000), an index investor maintains the same weight as the index.
Average Returns: An index investor will never have the opportunity to outperform the market, but will always follow. Although the markets are very efficient, an investor can perhaps take advantage of market anomalies and invest with those managers who have maintained a long-term performance edge over the respective index.
SPEAKING: Dr. Marcinko will be speaking and lecturing, signing and opining, teaching and preaching, storming and performing at many locations throughout the USA this year! His tour of witty and serious pontifications may be scheduled on a planned or ad-hoc basis; for public or private meetings and gatherings; formally, informally, or over lunch or dinner. All medical societies, financial advisory firms or Broker-Dealers are encouraged to submit an RFP for speaking engagements: CONTACT: Ann Miller RN MHA at MarcinkoAdvisors@outlook.com -OR-http://www.MarcinkoAssociates.com
Alpha: The measure of the amount of a stock’s expected return that is not related to the stock’s sensitivity to market volatility. It measures the residual non-market influences that contribute to a securities risk unique to each security.
Alpha uses beta as a measure of risk, a benchmark and a risk free rate of return (usually T-bills) to compare actual performance with expected performance.
For example, a fund with a beta of .80 in a market that rises 10% is expected to rise 8%. If the risk-free return is 3%, the alpha would be –.6%, calculated as follows:
To a large extent, your investment objectives are driven by your investment time horizon and the needs for cash that may arise from now until then. Once these objectives have been set, you must decide how to allocate assets in pursuit of your goals. Establishing the appropriate asset allocation for your portfolio is widely considered the most important factor in determining whether or not you meet your investment objectives. In fact, academic studies have determined that more than 90% of a portfolio’s return can be attributed to the asset allocation decision. The following will provide a historical perspective on the risks which need to be balanced when making the asset allocation decision, and the resulting implications regarding the way this important decision is made by investors today.
The Balance between Growth and Preservation of Capital
The asset allocation decision (i.e., identifying an appropriate mix between different types of investments, such as stocks, bonds and cash) is the primary tool available to manage risk for your portfolio. The goal of any asset allocation should be to provide a level of diversification for the portfolio, while also balancing the goals of growth and preservation of capital required to meet your objectives.
How do investment professionals make asset allocation decisions? One way is a passive approach, in which a set mix of stocks, bonds and cash is maintained based on a historical risk/return tradeoff. The alternative is an active approach, in which the expected tradeoff between risk and return for the asset classes is based upon the current market and economic environment.
Can any single mix of stocks, bonds and cash achieve your needs in every market environment that may arise over your investment time frame? If such a mix exists, then it is reasonable for you to maintain that particular passive asset allocation. On the other hand, if no single mix exists that will certainly meet your objectives over your time frame, and then some judgment must be made regarding the best mix for you on a forward-looking basis. This case implies that some form of active decision making is required when determining your portfolio’s asset allocation. To answer this question, let’s consider the historical tradeoff between the pursuit of growth and the need to preserve capital over various investment time frames.
Our first conclusion is that you have to be willing to commit a majority of your assets to stocks to pursue capital growth, but even an equity-oriented portfolio is not guaranteed to meet your growth goals over a long-term time period. To provide some historical perspective using Ibbotson data, a mix of 50% stocks and 50% bonds provided an 8.9% annualized return from 1926-1998, but failed to surpass what many consider to be a modest return of 8.0% in approximately 49% of the rolling ten and twenty year periods over this time. In fact, a portfolio of 100% stocks provided an 11.2% annualized return, but failed to surpass 8.0% in almost 1 of every 3 ten-year periods and more than 1 of every 4 twenty-year periods.
This data also reflects the difficulty through history of consistently achieving an 8.0% rate even with an aggressive mix of stocks and bonds. In this time of high flying stock markets, it is important to keep in mind that taking more risk is no guarantee of higher returns. However, what is clear from this data is the importance of allowing a manager the flexibility to achieve meaningful exposure to stocks in attractive market environments to pursue the goal of long-term capital growth.
The Need for Capital Preservation
Of course, there is a clear risk of long-term declines in an equity-oriented investment approach, especially for a portfolio dealing with interim cash needs (e.g., a defined benefit plan with ongoing benefit payments, a defined contribution plan with participants having different dates until retirement, or an endowment with ongoing withdrawal needs). An illustration of the sustained losses that may result from heavy allocations to stocks is the fact that 1 of every 4 one year periods and 1 of every 10 five-year periods resulted in a loss for a portfolio of 100% stocks. Even the 50% stock and 50% bond portfolio has seen losses in almost 1 of every 5 one-year periods and more than 1 of every 25 five-year periods over the past 73 years of available data. Thus, it is clear that no single mix of investments is likely to meet all of the needs for a portfolio in every market environment.
The Need for Active Management of Risk
The analysis to this point has discussed the need to balance long-term growth and preservation of capital, and it has summarized the tradeoff between these conflicting goals. There remains, however, an important issue regarding the appropriate stock exposure for you in the current environment. Even though returns over the long-term may have been strong for an all-stock portfolio, your returns will be very much dependent on the market conditions at the start of the investment period.
To set up this discussion, consider the risk of failing to achieve a target return of 5%, 8% or 10% in the S&P 500 over the last 44 years.
FAILURE RATES OF TARGET RETURNS IN STOCKS [1955-1998]
1 Year
3 Years
5 Years
10 Years
% Periods with Less Than a 5% Return:
32%
15%
17%
13%
% Periods with Less Than an 8% Return
38%
29%
27%
32%
% Periods with Less Than a 10% Return
41%
41%
41%
44%
Taking the risk of failing to achieve your return goals one step further, does this risk increase with an expensive stock market? Looking at several different stock valuation measures, the U.S. stock market is currently at historically extreme levels. As an example, the S&P Industrials price-to-sales ratio was 2.0 at the end of 1998. High valuation measures are often associated with periods of high volatility in stocks, and a price-to-sales ratio greater than 1.0 (i.e., ½ of current level) has historically been considered high.
FAILURE OF STOCKS TO MEET GOALS WHEN S&P INDUSTRIALS PRICE-TO-SALES RATIO IS GREATER THAN 1.0 [1955-1998]
1 Year
3 Years
5 Years
10 Years
% Periods with Less Than a 5% Return:
42%
26%
24%
45%
% Periods with Less Than an 8% Return
47%
55%
55%
79%
% Periods with Less Than a 10% Return
49%
71%
71%
97%
Understanding the Data
The data in the table above indicates that high market valuations significantly increase the risk of failing to achieve even moderate return goals. In all, there were 50 quarters from 1955 to 1998 in which the S&P Industrials price-to-sales ratio was over the 1.0. During these periods, strong returns were possible, but less likely to be sustained than when there are less optimistic valuations in the market. While this does not mean that a major correction or bear market will necessarily occur, the risk of failing to meet your goals is clearly higher than average based upon this data. Because the market is a discounting mechanism, the positive economic environment we see today may become over discounted, resulting in moderate returns until fundamentals catch up with the optimism.
Assessment
Clearly, history tells us that no single mix of assets may provide both long-term capital growth and stability of market values in all market and economic conditions. Far too often, investment professionals take a passive approach to asset allocation, relying on past average returns and correlations to determine asset allocation without a full understanding of the long periods of time in history over which there are significant deviations from long-term averages. This data confirms that a more active approach to asset allocation based on the risk faced in today’s market and economic environment is key to lowering the risk to your portfolio failing to meet its investment objectives.
Conclusion
And so, your thoughts and comments on this ME-P are appreciated. Feel free to review our top-left column, and top-right sidebar materials, links, URLs and related websites, too. Then, subscribe to the ME-P. It is fast, free and secure.
Speaker:If you need a moderator or speaker for an upcoming event, Dr. David E. Marcinko; MBA – Publisher-in-Chief of the Medical Executive-Post – is available for seminar or speaking engagements. Contact: MarcinkoAdvisors@msn.com
Subscribe Now:Did you like this Medical Executive-Post, or find it helpful, interesting and informative? Want to get the latest ME-Ps delivered to your email box each morning? Just subscribe using the link below. You can unsubscribe at any time. Security is assured.


