STOCK PERFORMANCE: Growth v. Value Investing for Physicians

BY DR. DAVID EDWARD MARCINKO: MBA MEd CMP™

***

SPONSOR: http://www.MarcinkoAssociates.com

***

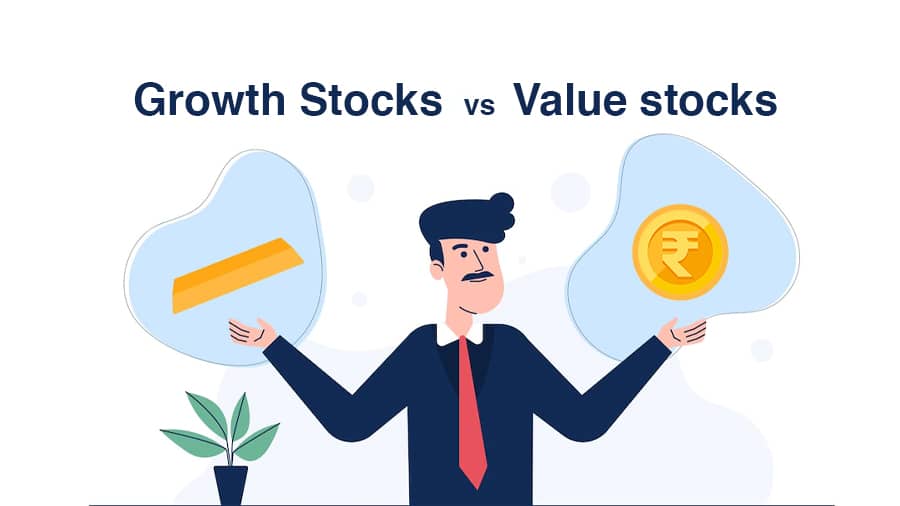
Performance of Growth & Value Stocks

Although many academics argue that value stocks outperform growth stocks, the returns for individuals investing through mutual funds demonstrate a near match. 

Introduction

A 2005 study Do Investors Capture the Value Premium? written by Todd Houge at The University of Iowa and Tim Loughran at The University of Notre Dame found that large company mutual funds in both the value and growth styles returned just over 11 percent for the period of 1975 to 2002. This paper contradicted many studies that demonstrated owning value stocks offers better long-term performance than growth stocks. 

The studies, led by Eugene Fama PhD and Kenneth French PhD, established the current consensus that the value style of investing does indeed offer a return premium. There are several theories as to why this has been the case, among the most persuasive being a series of behavioral arguments put forth by leading researchers. The studies suggest that the out performance of value stocks may result from investors’ tendency toward common behavioral traits, including the belief that the future will be similar to the past, overreaction to unexpected events, “herding” behavior which leads at times to overemphasis of a particular style or sector, overconfidence, and aversion to regret. All of these behaviors can cause price anomalies which create buying opportunities for value investors.

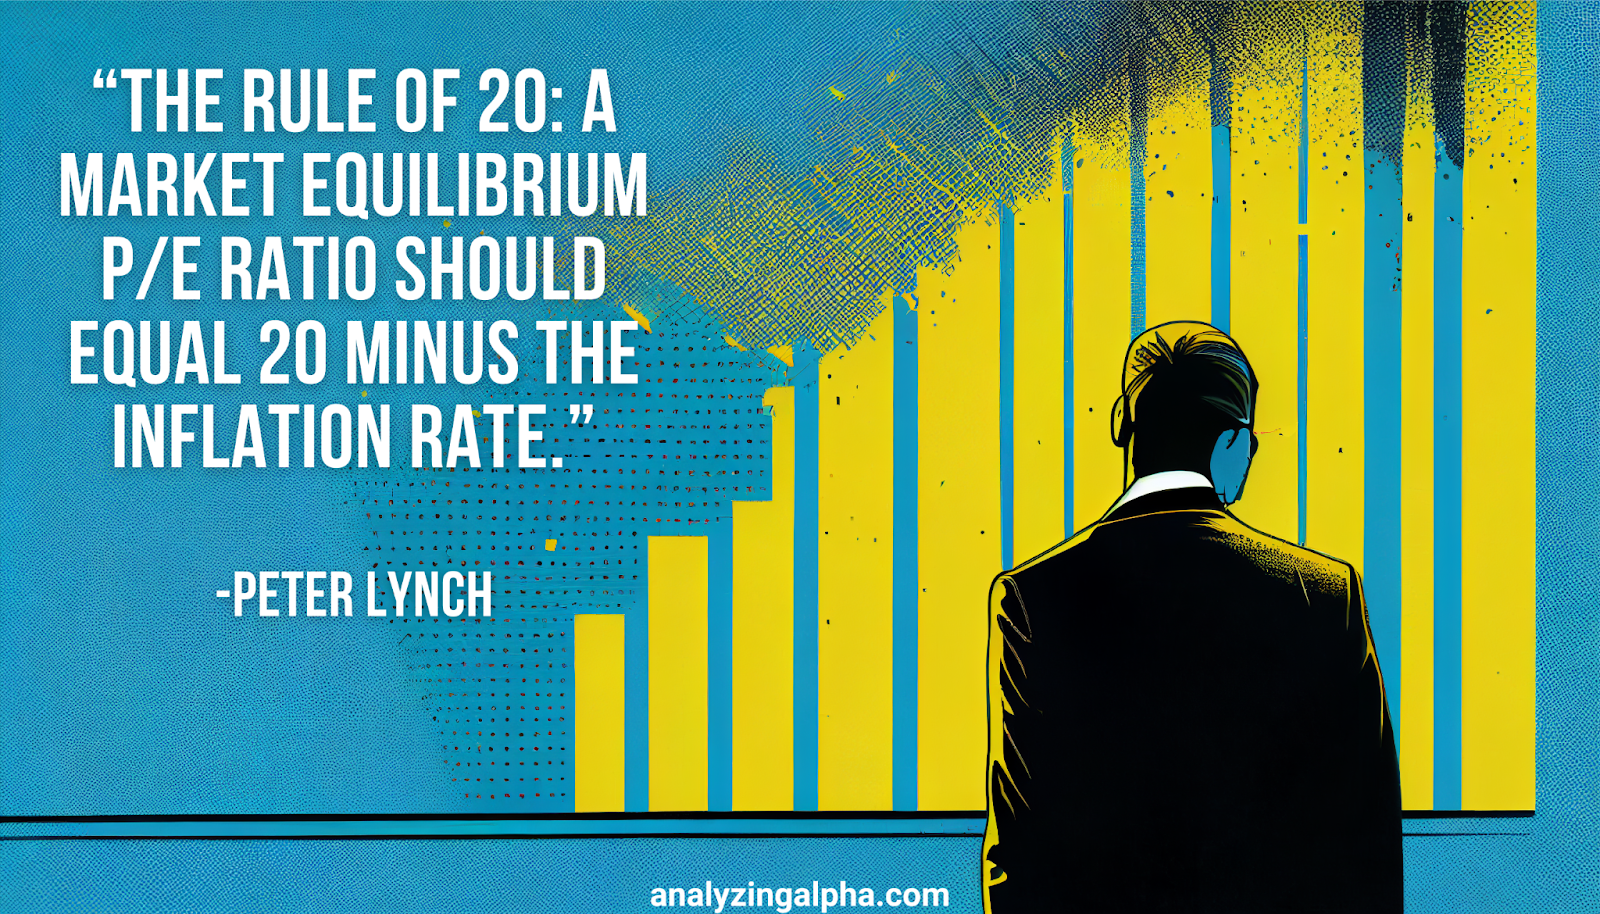
Another key ingredient argued for value out performance is lower business appraisals. Value stocks are plainly confined to a P/E range, whereas growth stocks have an upper limit that is infinite.  When growth stocks reach a high plateau in regard to P/E ratios, the ensuing returns are generally much lower than the category average over time. 

Moreover, growth stocks tend to lose more in bear markets.  In the last two major bear markets, growth stocks fared far worse than value.  From January 1973 until late 1974, large growth stocks lost 45 percent of their value, while large value stocks lost 26 percent. Similarly, from April 2000 to September 2002, large growth stocks lost 46 percent versus only 27 percent for large value stocks. These losses, academics insist, dramatically reduce the long-term investment returns of growth stocks.

***

***

However, the study by Houge and Loughran reasoned that although a premium may exist, investors have not been able to capture the excess return through mutual funds.  The study also maintained that any potential value premium is generated outside the securities held by most mutual funds.  Simply put, being growth or value had no material impact on a mutual fund’s performance.

Listed below in the table are the annualized returns and standard deviations for return data from January 1975 through December 2002.

Index                              Return                         SD      

S&P 500                            11.53%                     14.88%

Large Growth Funds         11.30%                     16.65%

Large Value Funds             11.41%                    15.39%

 Source:  Hough/Loughran Study

The Hough/Loughran study also found that the returns by style also varied over time.  From 1965-1983, a period widely known to favor the value style, large value funds averaged a 9.92 percent annual return, compared to 8.73 percent for large growth funds. This performance differential reverses over 1984-2001, as large growth funds generated a 14.1 percent average return compared to 12.9 percent for large value funds.  Thus, one style can outperform in any time period.

However, although the long-term returns are nearly identical, large differences between value and growth returns happen over time.   This is especially the case over the last ten years as growth and value have had extraordinary return differences – sometimes over 30 percentage points of under performance. 

This table indicates the return differential between the value and growth styles since 1992.

YEARLY RETURNS OF GROWTH/VALUE STOCKS

YearGrowthValue
19925.1%10.5%
19931.7%18.6%
19943.1%-0.6%
199538.1%37.1%
199624.0%22.0%
199736.5%30.6%
199842.2%14.7%
199928.2% 3.2%
2000-22.1%6.1%
2001-26.7%7.1%
2002-25.2%-20.5%
200328.2%27.7%
2004 6.3%16.5%
2005 3.6%6.1%
2006 10.8%20.6%
20078.8%1.5%
2008-38.43%-36.84%
200937.2%19.69%
201016.71%15.5%
20112.64%0.39%
201215.25%17.50%

Source:  Ibbottson.

Between the third quarter of 1994 and the second quarter of 2000, the S&P Growth Index produced annualized total returns of 30 percent, versus only about 18 percent for the S&P Value Index.  Since 2000, value has turned the tables and dramatically outperformed growth.  Growth has only outperformed value in two of the past eight years.  Since the two styles are successful at different times, combining them in one portfolio can create a buffer against dramatic swings, reducing volatility and the subsequent drag on returns. 

Assessment

In our analysis, the surest way to maximize the benefits of style investing is to combine growth and value in a single portfolio, and maintain the proportions evenly in a 50/50 split through regular rebalancing.  Research from Standard & Poor’s showed that since 1980, a 50/50 portfolio of value and growth stocks beats the market 75 percent of the time.

Conclusion

Due to the fact that both styles have near equal performance and either style can outperform for a significant time period, a medical professional might consider a blending of styles.  Rather than attempt to second-guess the market by switching in and out of styles as they roll with the cycle, it might be prudent to maintain an equal balance your investment between the two.

EDUCATION: Books

SPEAKING: Dr. Marcinko will be speaking and lecturing, signing and opining, teaching and preaching, storming and performing at many locations throughout the USA this year! His tour of witty and serious pontifications may be scheduled on a planned or ad-hoc basis; for public or private meetings and gatherings; formally, informally, or over lunch or dinner. All medical societies, financial advisory firms or Broker-Dealers are encouraged to submit a RFP for speaking engagements: MarcinkoAdvisors@outlook.com 

COMMENTS APPRECIATED

Refer, Subscribe and Like

***

***

CORPORATE EARNINGS: Per Share, Yield and EBDITA

DEFINITIONS

By Staff Reporters

SPONSOR: http://www.MarcinkoAssociates.com

***

***

Earnings per share (EPS): The portion of a company’s profits allocated to each outstanding share of its common stock. It is as an indicator of a company’s profitability.

Earnings yield: Earnings per share for the most recent 12 months, divided by the current market price per share; it is the inverse of the price to earnings (P/E) ratio.

EBITDA: Earnings before interest, taxes, depreciation and amortization (EBITDA) is an approximate measure of a company’s operating cash flow.

COMMENTS APPRECIATED

Subscribe and Refer

***

***

FINANCIAL: Rule of 20 Defined

A Dimensionless Number

By Staff Reporters

SPONSOR: http://www.MarcinkoAssociates.com

***

***

What is the Rule of 20?

The Rule of 20 is a dimensionless number that adds the current 12-month trailing Price to Earnings Ratio to the annual change in an index of the annual consumer inflation rate. A reading below 20, while a market is trending lower, means that we could be near a bottom.

In the United States, the most common index used is the broad-based S&P 500, and CPI-U is used as a proxy for inflation.

The Rule of 20 is purportedly a rule from Peter Lynch. In chapter 39 of Graham and Dodd’s seminal Security Analysis, they mention: “We would suggest that about 20 times average earnings is as high a price as can be paid in an investment purchase of a common stock” … with no mention of inflation.

Lynch’s formulation attempts to factor the ‘gravity’ of interest rates into the fair value of a stock. And, as you can see, the measure has fluctuated quite a bit. However, it has returned to roughly the 20 level repeatedly.

MORE: https://dqydj.com/sp-500-rule-of-20-calculator/

COMMENTS APPRECIATED

Subscribe and Like!

***

***

Guidelines for Using an Equity Analyst’s Report

Trusting and Testing Fundamental Research

By Dr. David Edward Marcinko; MBA, MEd, CMP™

[Publisher-in-Chief]

It is not unreasonable to doubt the research of some security analysts; as evidenced by Wall Street’s recent upward implosion.

And so, trust but verify with your on research is always a good idea for the physician or lay investor in 2024.

25 Questions to Ask and Answer

Now, as a former financial planner, and professional investment advisor, please allow me to suggest the following before purchasing any equity:

  • How recent is the stock price on the report? If it is not recent, what is the current price? What is the current price relative to the 52-week high and low?
  • What is the P/E on trailing earnings per share? What is the stock’s projected price, based on estimated earnings for the periods shown?
  • What is the cash flow per share and the price-to-cash-flow ratio?
  • What is the book value? Price to book?
  • What is the trading volume relative to the number of shares outstanding?
  • How many shares are outstanding? What is the market capitalization based on current stock price and current shares outstanding? Is it a small, medium, or large-cap company?
  • Is the number of shares on a fully diluted basis shown? Is the fully diluted P/E shown? If there is a significant difference, read the report to find out where the extra shares will come from (convertible stock, a new or re-issue) and what the likelihood is that a conversion or a new issue or re-issue will occur.
  • What is the company’s earnings growth history? Is it a growth company or a cyclical company?
  • Does the company pay a dividend? If so, what is the dividend history and the payout ratio?
  • What is the debt-to-equity ratio? What kind of debt is it (publicly owned bonds, loans, etc.), and when does it have to be paid? What is the annual interest expense?
  • What are the cash ratios? Can the company cover its current liabilities easily? What is the ratio of annual earnings to interest expense?
  • What business is the company in? Are there comparisons to other companies in the same business? Are they similar in size? What is the outlook for the industry?
  • What is the company’s share of the market for its product? Does it have a particular niche? Does it have patents or protected rights on a special product? When do they expire?
  • How do the company’s financial ratios compare to those of other companies in its industry? How do the company’s ratios compare to those of the market as a whole or to narrower industry indexes?
  • Who are the company’s competitors? What advantages does the company have over its competitors?
  • How old is the company? How long has it been public? How long has the current management been running it? Who is the current management, and have there been significant management changes in the recent past?
  • How much of the company’s stock is owned by management? How much is owned by large institutional investors?
  • What kind of labor force does the company rely on? Where is it located?
  • Who are the company’s major customers? Is one customer very important?
  • Who are the company’s major suppliers? Is the company very dependent on one supplier?
  • How is the product distributed? Are there important relationships with distributors? How many different distributors are there?
  • What are the profit margins of the company? Where do they come from (incremental sales over break-even, or are they directly related to sales, no matter what level)?
  • What is the inventory turnover? Is there a lot of old, highly valued (on-the-books) inventory?
  • What is the history of sales revenue growth? What is the history of product mix in sales revenue?
  • Did the company issuing the research report also serve as investment banker?

Assessment

What did we miss – please advise?

Conclusion

And so, your thoughts and comments on this ME-P are appreciated. Feel free to review our top-left column, and top-right sidebar materials, links, URLs and related websites, too. Then, be sure to subscribe to the ME-P. It is fast, free and secure.

Subscribe Now: Did you like this Medical Executive-Post, or find it helpful, interesting and informative? Want to get the latest ME-Ps delivered to your email box each morning?

Sponsors Welcomed

And, credible sponsors and like-minded advertisers are always welcomed.

Link: https://healthcarefinancials.wordpress.com/2007/11/11/advertise

***

PE Ratio versus PEG Ratio

PE versus PEG

By staff reporters

***

***

“Medical Management and Health Economics Education for Financial Advisors”

CMP® CURRICULUM: https://lnkd.in/eDTRHex
CMP® WEB SITE: https://lnkd.in/guWSApq

Your thoughts and comments are appreciated.

BUSINESS, FINANCE, INVESTING AND INSURANCE TEXTS FOR DOCTORS:

1 – https://lnkd.in/ebWtzGg

2 – https://lnkd.in/ezkQMfR

3 – https://lnkd.in/ewJPTJs

THANK YOU

***

Understanding Earnings per Share

One Component of Fundamental Stock Analysis

Staff Reporters

Savvy physician-investors know that probably the most important influence on the price of a stock is reported earnings per share (EPS). Quarterly earnings are multiplied by 4 to simulate upcoming annual earnings, but sometimes “trailing 4 quarters” (i.e., actual) earnings are used. Analysts usually project earnings for several upcoming quarters, and those estimates are used to project the stock price.

Definition

Companies are required to report EPS within 45 days of quarter-end and within 90 days of year-end. According to the Dictionary of Health Economics and Finance [www.HealthDictionarySeries.com], EPS may be defined as follows:

EPS = Net income – Preferred dividends / Number of outstanding shares    

This formula has the same numerator as ROE—income available to common shareholders (after interest and taxes). Undiluted EPS is called primary EPS. If securities exist that are likely to be converted into outstanding common shares (such as convertible preferred stock that is likely to be called, or options held by management that are likely to be exercised), fully diluted EPS are also calculated. EPS states earnings on a per-share basis, which makes it easy to generate the P/E multiple.

Stock Listings

The P/E often appears on website or in newspaper stock listings. With the P/E, the dollar value of current earnings can be backed out using the current stock price. If newly reported earnings are higher than expected, the P/E ratio will be lower than it has been and the stock will be selling at a “discount” to its own prior P/E. If newly reported earnings are lower than expected, the

P/E ratio will be higher than it has been, and the stock is said to be selling at a “premium” to its prior P/E.

Discount/Premium Indicator

A stock’s P/E may also show it selling at a discount or premium to the P/E of the market (an index, like the S&P 500) or the average P/E of other companies in the industry. If compared to the market, it is said to be trading at a high or low relative multiple. Most doctors find that a very high P/E is hard to justify buying—it usually means expectations for future earnings are unrealistic. Small company stocks will tend to have higher P/E ratios than large company stocks. When the multiples of small companies approach those of large companies, it signals a good buying opportunity in small stocks.

Price Tracks Earnings

Over the long term, most charts will show that the price of the stock eventually tracks earnings. The principle of value investing is basically to capture the stock when earnings have risen but the stock price hasn’t caught up and to sell when the price of the stock fully reflects the earnings rise.

A Growth Indicator

A valuable way to look at P/E ratio is to compare it to growth rate. A fairly priced company will have a P/E approximately equal to its earnings growth rate (i.e., a multiple of 12 with an EPS growth rate of 12%). If the multiple is below the growth rate, the stock is considered a bargain. A rule of thumb: A growth rate twice the multiple is a good buy; a growth rate half the multiple means stay away.

The Power of Growth

Physician-investors should never underestimate the power of growth. Even though a company has a high P/E, if the growth rate is also high it will make more money because of the power of compounding. The P/E calculated without cash in the price of the stock could be considered a truer measure of what the operating assets of the company are earning. A physician-investor may break down companies’ P/E further, attempting to find multiples for each business segment of a company.

Assessment

As seen, if it is likely that convertible securities, warrants, rights, or any other stock equivalents outstanding will be converted into common stock, fully diluted EPS are calculated. The fully diluted calculation adds back interest on convertible securities, assuming it will not be paid, but increases the number of shares outstanding. For companies that pay dividends, the dividend payout ratio is calculated by dividing the annual dividend paid by the EPS. A low dividend payout ratio may not be bad—it could indicate that the company is likely to be able to maintain the dividend level. When the dividend payout ratio for the entire market is low, it indicates that the overall market is at a high.

Conclusion

The dividend yield is calculated by dividing the annual dividend by the current price per share. Yields may look particularly high when share price is depressed and may help sustain demand for stocks like utilities. As in analysis of bonds, valuation of the dividend stream (present value of future cash flow) is often used to determine the intrinsic worth of stocks that pay steady dividends.

And so, your thoughts and comments on this Medical Executive-Post are appreciated. With the recent stock market slump, is this traditional ratio due for a popularity comeback by next-gen physician-investors?

Related Information Sources:

Practice Management: http://www.springerpub.com/prod.aspx?prod_id=23759

Physician Financial Planning: http://www.jbpub.com/catalog/0763745790

Medical Risk Management: http://www.jbpub.com/catalog/9780763733421

Healthcare Organizations: www.HealthcareFinancials.com

Health Administration Terms: www.HealthDictionarySeries.com

Physician Advisors: www.CertifiedMedicalPlanner.com

Speaker: If you need a moderator or speaker for an upcoming event, Dr. David E. Marcinko; MBA – Publisher-in-Chief of the Executive-Post – is available for seminar or speaking engagements. Contact: MarcinkoAdvisors@msn.com  or Bio: www.stpub.com/pubs/authors/MARCINKO.htm

Subscribe Now: Did you like this Medical Executive-Post, or find it helpful, interesting and informative? Want to get the latest E-Ps delivered to your email box each morning? Just subscribe using the link below. You can unsubscribe at any time. Security is assured.

Link: http://feeds.feedburner.com/HealthcareFinancialsthePostForcxos