BOARD CERTIFICATION EXAM STUDY GUIDES Lower Extremity Trauma
[Click on Image to Enlarge]
ME-P Free Advertising Consultation
The “Medical Executive-Post” is about connecting doctors, health care executives and modern consulting advisors. It’s about free-enterprise, business, practice, policy, personal financial planning and wealth building capitalism. We have an attitude that’s independent, outspoken, intelligent and so Next-Gen; often edgy, usually controversial. And, our consultants “got fly”, just like U. Read it! Write it! Post it! “Medical Executive-Post”. Call or email us for your FREE advertising and sales consultation TODAY [678.779.8597] Email: MarcinkoAdvisors@outlook.com
Medical & Surgical e-Consent Forms
ePodiatryConsentForms.com
iMBA Inc., OFFICES
Suite #5901 Wilbanks Drive, Norcross, Georgia, 30092 USA [1.678.779.8597]. Our location is real and we are now virtually enabled to assist new long distance clients and out-of-town colleagues.
ME-P Publishing
SEEKING INDUSTRY INFO PARTNERS?
If you want the opportunity to work with leading health care industry insiders, innovators and watchers, the “ME-P” may be right for you? We are unbiased and operate at the nexus of theoretical and applied R&D. Collaborate with us and you’ll put your brand in front of a smart & tightly focused demographic; one at the forefront of our emerging healthcare free marketplace of informed and professional “movers and shakers.” Our Ad Rate Card is available upon request [678-779-8597].
Financial Advisors and Financial Planners Usually Aren’t Millionaires
According to the most recent data from the Bureau of Labor Statistics (BLS), financial advisors had a median annual salary of $99,580 in 2023, which is significantly higher than the national average of $65,470. Of course, salaries of financial advisors can differ significantly by their location and level of expertise. The client’s profile may also have an impact on their compensation. But, many are not rich.
This is unfortunate. Financial advisors and Financial planners don’t rank among the millionaire professions in Thomas J. Stanley and William D. Danko’s book The Millionaire Next Door. Many work as salaried employees rather than entrepreneurs, lacking the scalable income potential of business owners who reinvest profits.
Stanley and Danko also stressed frugality, a challenge for advisors pressured to flaunt success—think luxury cars or upscale offices—making them “income-statement affluent” rather than “balance-sheet affluent.”
The truth is that a Financial Advisors’ success isn’t measured in client returns. Instead it is measured in their ability to gather assets and retain clients. In other words; Financial Advisors do not need to be good with money.
Financial Advisors need to be good with marketing, advertising, sales and people.
SPEAKING: Dr. Marcinko will be speaking and lecturing, signing and opining, teaching and preaching, storming and performing at many locations throughout the USA this year! His tour of witty and serious pontifications may be scheduled on a planned or ad-hoc basis; for public or private meetings and gatherings; formally, informally, or over lunch or dinner. All medical societies, financial advisory firms or Broker-Dealers are encouraged to submit a RFP for speaking engagements: MarcinkoAdvisors@outlook.com
Financial Modeling is one of the most highly valued, but thinly understood, skills in financial analysis. The objective of financial modeling is to combine accounting, finance, and business metrics to create a forecast of a company’s future results.
According to Jeff Schmidt, a financial model is simply a spreadsheet, usually built in Microsoft Excel, that forecasts a business’s financial performance into the future. The forecast is typically based on the company’s historical performance and assumptions about the future and requires preparing an income statement, balance sheet, cash flow statement, and supporting schedules (known as a three-statement model, one of many types of approaches to financial statement modeling). From there, more advanced types of models can be built such as discounted cash flow analysis (DCF model), leveraged buyout (LBO), mergers and acquisitions (M&A), and sensitivity analysis
***
DEFINED TERMS
Discounted Cash Flow (DCF): A valuation method used to estimate the value of an investment based on its expected future cash flows, adjusted for the time value of money. It’s like deciding whether a treasure chest is worth diving for now, based on the gold coins you’ll be able to cash in later.
Sensitivity Analysis: This involves changing one variable at a time to see how it affects an outcome. Imagine tweaking your coffee-to-water ratio each morning to achieve the perfect brew strength.
Budget – A budget is the amount of money a department, function, or business can spend in a given period of time. Usually, but not always, finance does this annually for the upcoming year.
Rolling Forecast – A rolling forecast maintains a consistent view over a period of time (often 12 months). When one period closes, finance adds one more period to the forecast.
Topside – A topside adjustment is an overlay to a forecast. This is typically completed by the corporate or headquarter team. As individual teams submit a forecast, the consolidated result might not make sense or align with expectations. When this occurs, the high-level teams use a topside adjustment to streamline or adjust the consolidated view.
Monte Carlo Simulation: Picture yourself at the casino, but instead of gambling your savings away, you’re using this technique to predict different outcomes of your business decisions based on random variables. It’s like playing financial roulette with the odds in your favor.
What-If Analysis: Ever daydream about what would happen if you took that leap of faith with your business? This tool allows you to explore various scenarios without risking a dime. It’s like trying on outfits in a virtual dressing room before making a purchase.
Leveraged Buyout (LBO) Model: This is a bit like orchestrating a heist, but legally. It’s about acquiring a company using borrowed money, with plans to pay off the debts with the company’s own cash flows. High stakes, high rewards.
Mergers and Acquisitions (M&A) Model: Picture two puzzle pieces coming together. This model evaluates how combining companies can create a new, more valuable entity. It’s the corporate version of a matchmaker.
Three Statement Model: The holy trinity of financial modeling, linking the income statement, balance sheet, and cash flow statement. It’s like weaving a tapestry where each thread is crucial to the overall picture.
Capital Asset Pricing Model (CAPM): A formula that calculates the expected return on an investment, considering its risk compared to the market. It’s like choosing the best roller coaster in the park, balancing thrill and safety.
Cash Flow Forecasting: This is your financial weather forecast, predicting the cash flow climate of your business. It helps you plan for sunny days and save for the rainy ones.
Cost of Capital: The price of financing your business, whether through debt or equity. It’s like the interest rate on your growth engine, pushing you to maximize every dollar invested.
Debt Schedule: A timeline of your business’s debts, showing when and how much you owe. It’s your roadmap to becoming debt-free, one milestone at a time.
Equity Valuation: Determining the value of a company’s shares. It’s like assessing the worth of a rare gemstone, ensuring investors pay a fair price for a piece of the treasure.
Financial Leverage: Using debt to amplify returns on investment. It’s like using a lever to lift a heavy object, increasing force but also risk.
Forecast Model: A crystal ball for your finances, projecting future performance based on past and present data. It’s your guide through the financial wilderness, helping you navigate with confidence.
Operating Model: A detailed blueprint of how a business generates value, mapping out operational activities and their financial impact. It’s like laying out the inner workings of a clock, ensuring every gear turns smoothly.
Revenue Growth Model: This tracks potential increases in sales over time, charting a course for expansion. It’s like plotting your ascent up a mountain, anticipating the effort required to reach the summit.
When analyzing a set of financial statements to determine practice value, adjustments (normalizations) generally are needed to produce a clearer picture of likely future income and distributable cash flow. It also allows more of an “apples to apples” line item comparison. This normalization process usually consists of making three main adjustments to a medical practice’s net income (profit and loss) statement.
1. Non-Recurring Items: Estimates of future distributable cash flow should exclude non-recurring items. Proceeds from the settlement of litigation, one-time gains/losses from the selling of assets or equipment, and large write-offs that are not expected to reoccur, each represent potential nonrecurring items. The impact of nonrecurring events should be removed from the practice’s financial statements to produce a clearer picture of likely future income and cash flow.
2. Perquisites: The buyer of a medical practice may plan to spend more or less than the current doctor-owner for physician executive compensation, travel and entertainment expenses, and other perquisites of current management. When determining future distributable cash flow, income adjustments to the current level of expenditures should be made for these items.
3. Non-cash Expenses: Depreciation expense, amortization expense, and bad debt expense are all non-cash items which impact reported profitability. When determining distributable cash flow, you must analyze the link between non-cash expenses and expected cash expenditures.
The annual depreciation expense is a proxy for likely capital expenditures over time. When capital expenditures and depreciation are not similar over time, an adjustment to expected cash flow is necessary. Some practices reduce income through the use of bad debt expense rather than direct write-offs. Bad debt expense is a non-cash expense that represents an estimate of the dollar volume of write-offs that are likely to occur during a year. If bad debt expense is understated, practice profitability will be overstated.
***
***
Balance Sheet Adjustments
Adjustments also can be made to a practice’s balance sheet to remove non-operating assets and liabilities, and to restate asset and liability value at market rates (rather than cost rates). Assets and liabilities that are unrelated to the core practice being valued should be added to or subtracted from the value, depending on whether they are acquired by the buyer.
Examples include the asset value less outstanding debt of a vacant parcel of land, and marketable securities that are not needed to operate the practice. Other non-operating assets, such as the cash surrender value of officer life insurance, generally are liquidated by the seller and are not part of the business transaction.
SPEAKING: Dr. Marcinko will be speaking and lecturing, signing and opining, teaching and preaching, storming and performing at many locations throughout the USA this year! His tour of witty and serious pontifications may be scheduled on a planned or ad-hoc basis; for public or private meetings and gatherings; formally, informally, or over lunch or dinner. All medical societies, financial advisory firms or Broker-Dealers are encouraged to submit a RFP for speaking engagements: CONTACT: MarcinkoAdvisors@outlook.com
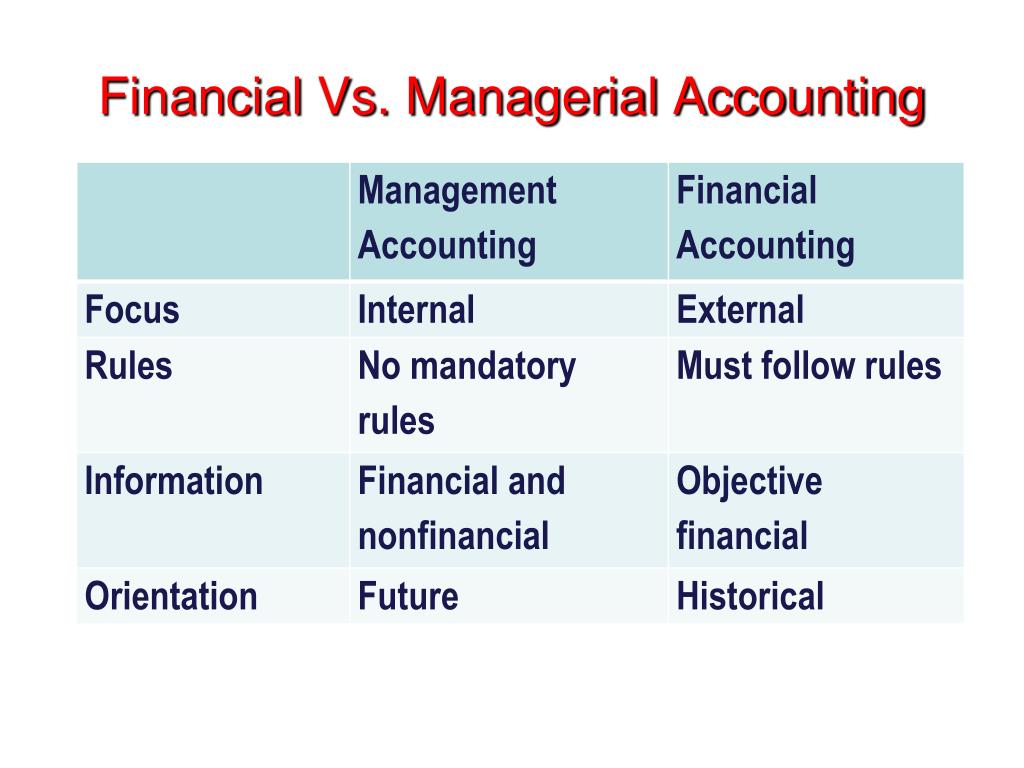
Financial accounting and managerial accounting are two distinct branches of the accounting field, each serving different purposes and stakeholders. Financial accounting focuses on creating external reports that provide a snapshot of a company’s financial health for investors, regulators, and other outside parties. Managerial accounting, meanwhile, is an internal process aimed at aiding managers in making informed business decisions.
Objectives of Financial Accounting
Financial accounting is primarily concerned with the preparation and presentation of financial statements, which include the balance sheet, income statement, and cash flow statement. These documents are meticulously crafted to reflect the company’s financial performance over a specific period, providing insights into its profitability, liquidity, and solvency. The objective is to offer a clear, standardized view of the financial state of the company, ensuring that external entities have a reliable basis for evaluating the company’s economic activities.
The process of financial accounting also involves the meticulous recording of all financial transactions. This is achieved through the double-entry bookkeeping system, where each transaction is recorded in at least two accounts, ensuring that the accounting equation remains balanced. This systematic approach provides accuracy and accountability, which are paramount in financial reporting. CPA = Certified Public Accountant.
Objectives of Managerial Accounting
Managerial accounting is designed to meet the information needs of the individuals who manage organizations. Unlike financial accounting, which provides a historical record of an organization’s financial performance, managerial accounting focuses on future-oriented reports. These reports assist in planning, controlling, and decision-making processes that guide the day-to-day, short-term, and long-term operations.
At the heart of managerial accounting is budgeting. Budgets are detailed plans that quantify the economic resources required for various functions, such as production, sales, and financing. They serve as benchmarks against which actual performance can be measured and evaluated. This enables managers to identify variances, investigate their causes, and implement corrective actions. Another objective of managerial accounting is cost analysis. Managers use cost accounting methods to understand the expenses associated with each aspect of production and operation. By analyzing costs, they can determine the profitability of individual products or services, control expenditures, and optimize resource allocation.
Performance measurement is another key objective. Managerial accountants develop metrics and key performance indicators (KPIs) to assess the efficiency and effectiveness of various business processes. These performance metrics are crucial for setting goals, evaluating outcomes, and aligning individual and departmental objectives with the overall strategy of the organization. CMA = Certified Managerial Accountant
Reporting Standards in Financial Accounting
The bedrock of financial accounting is the adherence to established reporting standards, which ensure consistency, comparability, and transparency in financial statements. Globally, the International Financial Reporting Standards (IFRS) are widely adopted, setting the guidelines for how particular types of transactions and other events should be reported in financial statements. In the United States, the Financial Accounting Standards Board (FASB) issues the Generally Accepted Accounting Principles (GAAP), which serve a similar purpose. These standards are not static; they evolve in response to changing economic realities, stakeholder needs, and advances in business practices.
For instance, the shift towards more service-oriented economies and the rise of intangible assets have led to updates in revenue recognition and asset valuation guidelines. The convergence of IFRS and GAAP is an ongoing process aimed at creating a unified set of global standards that would benefit multinational corporations and investors by reducing the complexity and cost of complying with multiple accounting frameworks.
Earnings before interest, taxes, depreciation, and amortization
A company’s earnings before interest, taxes, depreciation, and amortization is an accounting measure calculated using a company’s earnings, before interest expenses, taxes, depreciation, and amortization are subtracted, as a proxy for a company’s current operating profitability. Though often shown on an income statement, it is not considered part of the Generally Accepted Accounting Principles by the SEC.
Posted on June 16, 2009 by Dr. David Edward Marcinko MBA MEd CMP™
Understanding Rationale and Formulae
[By Dr. David Edward Marcinko; MBA, CMP™]
[By Dr. Gary L. Bode; CPA, MSA, CMP™]
Medical practices, clinics and hospitals generate a patient account or an account receivable (AR) at the same time as they send the patient a bill or the insurance company a claim. ARs are treated as current assets (cash equivalents) on the healthcare entity balance sheet, and usually with a percentage mark-down to reflect historic collection rates.
The Balance Sheet
The balance sheet is a snapshot of a medical practice or healthcare entity at a specific point in time. This contrasts with the income statement (profit and loss), which shows accounting data across a period of time. The balance sheet uses the accounting formula:
Assets (what the entity owns) = Liabilities (what the entity owes) + Entity Equity (left over).
AR Aging Schedules
According to the Dictionary of Health Economics and Finance, an AR aging schedule is a periodic report (30, 60, 90, 180, or 360 days) showing all outstanding ARs identified by patient or payor, and month due. The average duration of an AR is equal to total claims, divided by accounts receivable. Faster is better, of course, but it is not unusual for a hospital to wait six, nine, twelve months, or more for payment. Each of these measures seeks to answer two questions:
1) How many days of revenue are tied up in ARs?
2) How long does it take to collect ARs?
More Formulae
An important measure in the analysis of accounts receivable is the AR Ratio, AR Turnover Rate, and Average Days Receivables, expressed by these formulae:
1. AR Ratio = Current AR Balance / Average Monthly Gross Production
(suggested between 1 and 3 for hospitals)
2. AR Turnover Rate = AR Balance / Average Monthly Receipts
3. Average Days Receivable = AR Balance / Daily Average Charges
(suggested < 90 days for medical practices)
And Even More Measures
Other significant measures include:
1. Collection Period = ARs / Net Patient Revenue / 365 days
2. Gross Collection Percentage = Clinic Collections / Clinic Production
(suggested > 40-80% for hospitals)
3. Net Collection Percentage = Clinic Collections / Clinic Production – (minus) Contractual Adjustments (suggested > 80-90% for medical practices)
4. Contractual Percentage = Contractual adjustments / Gross production
(suggested < 40-50% for hospitals).
Assessment
Often, older ARs are often written off, or charged back as bad debt expenses and never collected at all.
Conclusion
Your thoughts and comments on this ME-P are appreciated. Feel free to review our top-left column, and top-right sidebar materials, links, URLs and related websites, too. Then, subscribe to the ME-P. It is fast, free and secure.
Speaker: If you need a moderator or speaker for an upcoming event, Dr. David E. Marcinko; MBA – Publisher-in-Chief of the Medical Executive-Post – is available for seminar or speaking engagements. Contact: MarcinkoAdvisors@msn.com
OUR OTHER PRINT BOOKS AND RELATED INFORMATION SOURCES: