CAP-M
***
***
By Dr. David Edward Marcinko MBA MED CMP™
SPONSOR: http://www.CertifiedMedicalPlanner.org
***
***
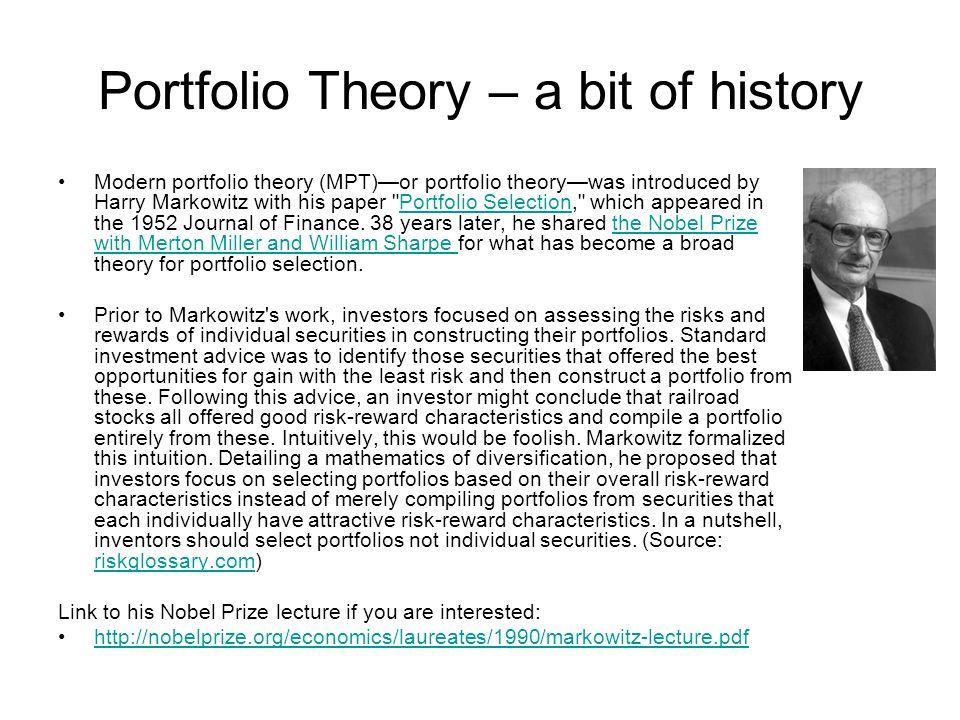
Dr. Harry Markowitz is credited with developing the framework for constructing investment portfolios based on the risk-return tradeoff. William Sharpe, John Lintner, and Jan Mossin are credited with developing the Capital Asset Pricing Model (CAPM).
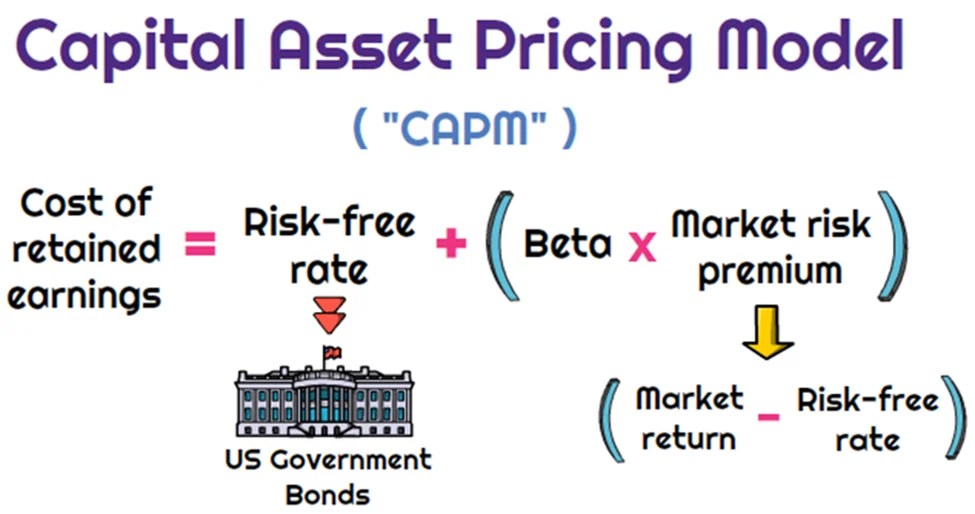
CAPM is an economic model based upon the idea that there is a single portfolio representing all investments (i.e., the market portfolio) at the point of the optimal portfolio on the Capital Market Line (CML) and a single source of systematic risk, beta, to that market portfolio. The resulting conclusion is that there should be a “fair” return investors should expect to receive given the level of risk (beta) they are willing to assume.
The excess return, or return above the risk-free rate, that may be expected from an asset is equal to the risk-free return plus the excess return of the market portfolio times the sensitivity of the asset’s excess return to the market portfolio excess return. Beta, then, is a measure of the sensitivity of an asset’s returns to the market as a whole. A particular security’s beta depends on the volatility of the individual security’s returns relative to the volatility of the market’s returns, as well as the correlation between the security’s returns and the markets returns.
While a stock may have significantly greater volatility than the market, if that stock’s returns are not highly correlated with the returns of the overall market (i.e., the stock’s returns are independent of the overall market’s returns), then the stock’s beta would be relatively low. A beta in excess of 1.0 implies that the security is more exposed to systematic risk than the overall market portfolio, and likewise, a beta of less 1.0 means that the security has less exposure to systematic risk than the overall market.
MPT has helped focus investors on two extremely critical elements of investing that are central to successful investment strategies.
First, MPT offers the first framework for investors to build a diversified portfolio. Furthermore, an important conclusion that can be drawn from MPT is that diversification does in fact help reduce portfolio risk.
Thus, MPT approaches are generally consistent with the first investment rule of thumb, “understand and diversify risk to the extent possible.”
Additionally, the risk/return tradeoff (i.e., higher returns are generally consistent with higher risk) central to MPT based strategies has helped investors recognize that if it looks too good to be true, it probably is.
Passive Investing
Passive investing is a monetary plan in which an investor invests in accordance with a pre-determined strategy that doesn’t necessitate any forecasting of the economy or an individual company’s prospects. The primary premise is to minimize investing fees and to avoid the unpleasant consequences of failing to correctly predict the future. The most accepted method to invest passively is to mimic the performance of a particular index. Investors typically do this today by purchasing one or more ‘index funds’. By tracking an index, an investor will achieve solid diversification with low expenses.
An ivestor could potentially earn a higher rate of return than an investor paying higher management fees. Passive management is most widespread in the stock markets. But with the explosion of exchange traded funds on the major exchanges, index investing has become more popular in other categories of investing. There are now literally hundreds of different index funds.
Passive management is based upon the Efficient Market Hypothesis theory. The Efficient Market Hypothesis (EMH) states that securities are fairly priced based on information regarding their underlying cash flows and that investors should not anticipate to consistently out-perform the market over the long-term.
The Efficient Market Hypothesis evolved in the 1960s from the Ph.D. dissertation of Eugene Fama. Fama persuasively made the case that in an active market that includes many well-informed and intelligent investors, securities will be appropriately priced and reflect all available information. If a market is efficient, no information or analysis can be expected to result in out-performance of an appropriate benchmark. There are three distinct forms of EMH that vary by the type of information that is reflected in a security’s price:
- Weak Form
This form holds that investors will not be able to use historical data to earn superior returns on a consistent basis. In other words, the financial markets price securities in a manner that fully reflects all information contained in past prices.
- Semi-Strong Form
This form asserts that security prices fully reflect all publicly available information. Therefore, investors cannot consistently earn above normal returns based solely on publicly available information, such as earnings, dividend, and sales data.
- Strong Form
This form states that the financial markets price securities such that, all information (public and non-public) is fully reflected in the securities price; investors should not expect to earn superior returns on a consistent basis, no matter what insight or research they may bring to the table.
While a rich literature has been established regarding whether EMH actually applies in any of its three forms in real world markets, probably the most difficult evidence to overcome for backers of EMH is the existence of a vibrant money management and mutual fund industry charging value-added fees for their services.
The notion of passive management is counterintuitive to many investors. Passive investing proponents follow the strong market theory of EMH. These proponents argue several points including;
- In the long term, the average investor will have a typical before-costs performance equal to the market average. Therefore the standard investor will gain more from reducing investment costs than from attempting to beat the market over time.
- The efficient-market hypothesis argues that equilibrium market prices fully reflect all existing market information. Even in the case where some of the market information is not currently reflected in the price level, EMH indicates that an individual investor still cannot make use of that information. It is widely interpreted by many academics that to try and systematically “beat the market” through active management is a fools game.
Not everyone believes in the efficient market. Numerous researchers over the previous decades have found stock market anomalies that indicate a contradiction with the hypothesis. The search for anomalies is effectively the hunt for market patterns that can be utilized to outperform passive strategies. Such stock market anomalies that have been proven to go against the findings of the EMH theory include;
- Low Price to Book Effect
- January Effect
- The Size Effect
- Insider Transaction Effect
- The Value Line Effect
All the above anomalies have been proven over time to outperform the market. For example, the first anomaly listed above is the Low Price to Book Effect. The first and most discussed study on the performance of low price to book value stocks was by Dr. Eugene Fama and Dr. Kenneth R. French. The study covered the time period from 1963-1990 and included nearly all the stocks on the NYSE, AMEX and NASDAQ. The stocks were divided into ten subgroups by book/market and were re-ranked annually. In the study, Fama and French found that the lowest book/market stocks outperformed the highest book/market stocks by a substantial margin (21.4 percent vs. 8 percent). Remarkably, as they examined each upward decile, performance for that decile was below that of the higher book value decile. Fama and French also ordered the deciles by beta (measure of systematic risk) and found that the stocks with the lowest book value also had the lowest risk.
Today, most researchers now deem that “value” represents a hazard feature that investors are compensated for over time. The theory being that value stocks trading at very low price book ratios are inherently risky, thus investors are simply compensated with higher returns in exchange for taking the risk of investing in these value stocks. The Fama and French research has been confirmed through several additional studies. In a Forbes Magazine 5/6/96 column titled “Ben Graham was right–again,” author David Dreman published his data from the largest 1500 stocks on Compustat for the 25 years ending 1994. He found that the lowest 20 percent of price/book stocks appreciably outperformed the market.
One item a medical professional should be aware of is the strong paradox of the efficient market theory. If each investor believes the stock market were efficient, then all investors would give up analyzing and forecasting. All investors would then accept passive management and invest in index funds. But if this were to happen, the market would no longer be efficient because no one would be scrutinizing the markets. In actuality, the efficient market hypothesis actually depends on active investors attempting to outperform the market through diligent research.
The case for passive investing and in favor of the EMH is that a preponderance of active managers do actually underperform the markets over time. The latest study by Standard and Poor’s (S&P) confirms this fact. S&P recently compared the performance of actively-managed mutual funds to passive market indexes twice per year. The 2012 S&P study indicated that indexes were once again outperforming actively-managed funds in nearly every asset class, style and fund category. The lone exception in the 2012 report was international equity, where active outperformed the index that S&P chose. The study examined one-year, three-year and five-year time periods. Within the U.S. equity space, active equity managers in all the categories failed to outperform the corresponding benchmarks in the past five year period. More than 65 percent of the large-cap active managers lagged behind the S&P 500 stock index. More than 81 percent of mid-cap mutual funds were outperformed by the S&P MidCap 400 index.
Lastly, 77 percent of the small-cap mutual funds were outperformed by the S&P SmallCap 600 index. U.S. bond active managers fared no better that equity managers over a five year period. More than 83 percent of general municipal mutual funds under-performed the S&P National AMT-Free Municipal Bond index, 93 percent of government long-term funds under-performed the Barclays Long Government index, nearly 95 percent of high yield corporate bond funds under-performed the Barclays High Yield index. Although the performance measurements for index investing are very strong, many analysts find three negative elements of passive investing;
- Downside Protection: When the stock market collapses like in 2008, an index investor will assume the same loss as the market. In the case of 2008, the S&P 500 stock index fell by more than 50 percent, offering index investors no downside protection.
- Portfolio Control: An index investor has no control over the holdings in the fund. In the event that a certain sector becomes over-owned (i.e. technology stocks in 2000), an index investor maintains the same weight as the index.
- Average Returns: An index investor will never have the opportunity to outperform the market, but will always follow. Although the markets are very efficient, an investor can perhaps take advantage of market anomalies and invest with those managers who have maintained a long-term performance edge over the respective index.
COMMENTS APPRECIATED
SPEAKING: Dr. Marcinko will be speaking and lecturing, signing and opining, teaching and preaching, storming and performing at many locations throughout the USA this year! His tour of witty and serious pontifications may be scheduled on a planned or ad-hoc basis; for public or private meetings and gatherings; formally, informally, or over lunch or dinner. All medical societies, financial advisory firms or Broker-Dealers are encouraged to submit an RFP for speaking engagements: CONTACT: Ann Miller RN MHA at MarcinkoAdvisors@outlook.com -OR- http://www.MarcinkoAssociates.com
Like, Refer and Subscribe
***
***
Share this:

Filed under: "Ask-an-Advisor", Estate Planning, finance, Financial Planning, Glossary Terms, Investing, Marcinko Associates, Portfolio Management, Retirement and Benefits, Touring with Marcinko | Tagged: alpha, Barclays, beta, CAP-M, Capital Asset Pricing Model, capital market line, CML, David Dreman, david marcinko, DJIA, DOW, efficient market hypothesis, ENH, Fama and French, Forbes, Harry Markowitz, Investing, January Effect, Lintner, Mossin, NASDAQ, physican colleagues, S&P 500, Sharpe, SIZE EFFECT, value line effect | Leave a comment »