By Dr. David Edward Marcinko MBA MEd
***
***
In the field of investment analysis, one of the most important challenges is balancing risk and reward. Investors want to maximize returns, but they also want to minimize the chances of losing money. Traditional measures such as the Sharpe Ratio have long been used to evaluate risk‑adjusted performance, but they treat all volatility the same. This means that both upward and downward swings in returns are penalized equally, even though investors generally welcome upside volatility. To address this limitation, the Sortino Ratio was developed as a more refined tool that focuses specifically on downside risk.
Definition and Formula
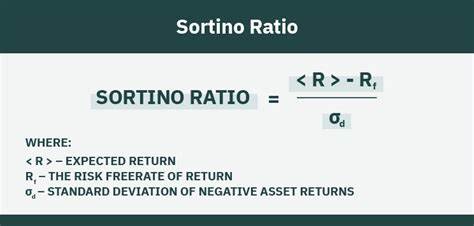
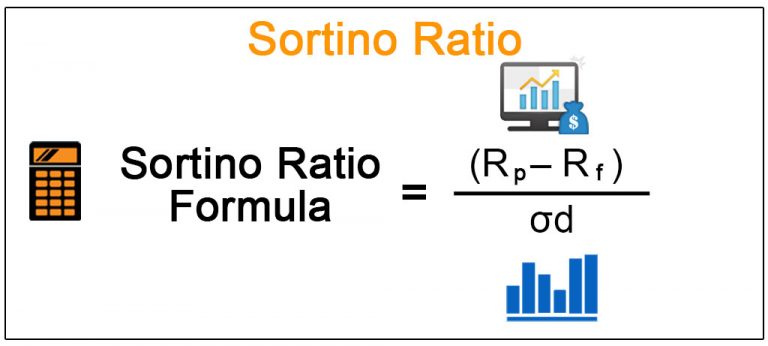
The Sortino Ratio measures the excess return of an investment relative to the risk‑free rate, divided by the standard deviation of negative returns. In formula form:
Sortino Ratio=Rp−Rfσd\text{Sortino Ratio} = \frac{R_p – R_f}{\sigma_d}
Where:
- RpR_p = portfolio or investment return
- RfR_f = risk‑free rate
- σd\sigma_d = standard deviation of downside returns
This formula highlights the unique feature of the Sortino Ratio: it only considers harmful volatility, ignoring fluctuations that exceed expectations.
Why It Matters
The key advantage of the Sortino Ratio is its ability to separate “good” volatility from “bad” volatility. Upside volatility, which represents returns above the target or minimum acceptable rate, is not penalized. Downside volatility, which represents returns below expectations, is penalized heavily. This distinction makes the Sortino Ratio especially useful for investors who prioritize capital preservation. For example, retirees or individuals saving for short‑term goals may prefer investments with higher Sortino Ratios because they indicate stronger protection against losses.
Practical Applications
The Sortino Ratio has several practical uses:
- Portfolio Evaluation: Investors can compare funds or strategies using the Sortino Ratio. A higher ratio suggests better risk‑adjusted performance.
- Risk Management: By focusing on downside deviation, managers can identify investments that minimize losses during downturns.
- Goal‑Oriented Investing: For individuals with specific financial targets, the Sortino Ratio helps ensure that chosen investments align with their tolerance for risk.
For instance, a mutual fund with a Sortino Ratio of 2 is generally considered strong, meaning it generates twice the return per unit of downside risk.
Comparison with the Sharpe Ratio
While both the Sharpe and Sortino Ratios measure risk‑adjusted returns, they differ in how they treat volatility. The Sharpe Ratio penalizes all fluctuations, whether positive or negative. The Sortino Ratio, however, only penalizes harmful volatility. This makes the Sortino Ratio more investor‑friendly, especially for those who care more about avoiding losses than capturing every possible gain. In practice, the Sharpe Ratio is better for broad comparisons across asset classes, while the Sortino Ratio is better for evaluating downside protection in portfolios.
Limitations
Despite its strengths, the Sortino Ratio is not without limitations:
- Data Sensitivity: It requires accurate downside deviation data, which can be difficult to calculate.
- Threshold Choice: Results vary depending on the minimum acceptable return chosen.
- Context Dependence: It should be used alongside other metrics, such as the Sharpe or Treynor Ratios, for a complete picture of risk and return.
Conclusion
The Sortino Ratio is a powerful tool for investors who want to measure performance while minimizing exposure to harmful volatility. By focusing exclusively on downside risk, it provides a more realistic assessment of whether returns justify the risks taken. While not perfect, it complements other risk‑adjusted metrics and is especially valuable for investors with low tolerance for losses. In today’s uncertain markets, understanding and applying the Sortino Ratio can help investors make smarter, more resilient decisions.
COMMENTS APPRECIATED
SPEAKING: Dr. Marcinko will be speaking and lecturing, signing and opining, teaching and preaching, storming and performing at many locations throughout the USA this year! His tour of witty and serious pontifications may be scheduled on a planned or ad-hoc basis; for public or private meetings and gatherings; formally, informally, or over lunch or dinner. All medical societies, financial advisory firms or Broker-Dealers are encouraged to submit an RFP for speaking engagements: CONTACT: Ann Miller RN MHA at MarcinkoAdvisors@outlook.com -OR- http://www.MarcinkoAssociates.com
Like, Refer and Subscribe
***
***
Share this:

Filed under: "Ask-an-Advisor", economics, finance, Financial Planning, Funding Basics, Glossary Terms, Marcinko Associates, Portfolio Management | Tagged: bad volatility, david marcinko, downside risk, finance, good volatility, Investing, personal-finance, Risk Adjusted Rate Return, Sharpe Ratio, sortino ratio, stock market, stocks | Leave a comment »