By Dr. David Edward Marcinko MBA MEd
BASIC DEFINITIONS
***

***
The velocity of money is a fundamental concept in macroeconomics that measures how quickly money circulates through the economy. It reflects the frequency with which a unit of currency is used to purchase goods and services within a given time period. This metric is crucial for understanding economic activity, inflation, and the effectiveness of monetary policy.
At its core, the velocity of money is calculated using the formula:
Velocity = GDPMoney Supply\text{Velocity} = \frac{\text{GDP}}{\text{Money Supply}}
This equation shows how many times money turns over in the economy to support a given level of economic output. For example, if the GDP is $20 trillion and the money supply (say, M2) is $10 trillion, the velocity is 2—meaning each dollar is used twice in a year to purchase goods and services.
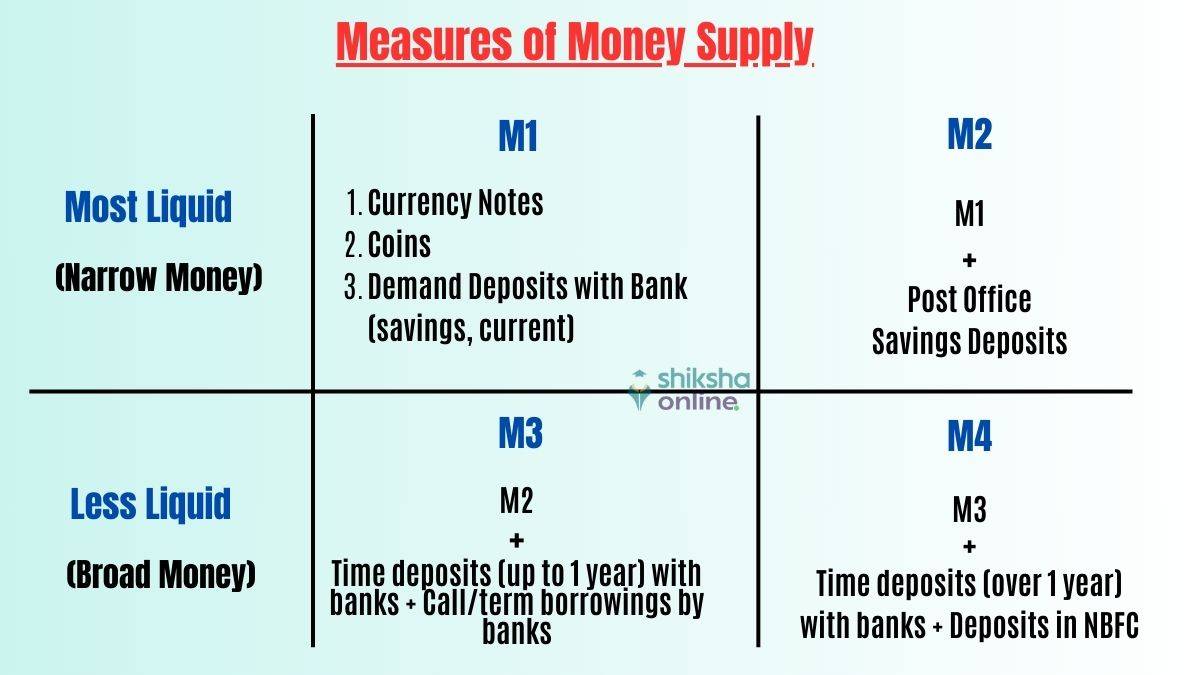
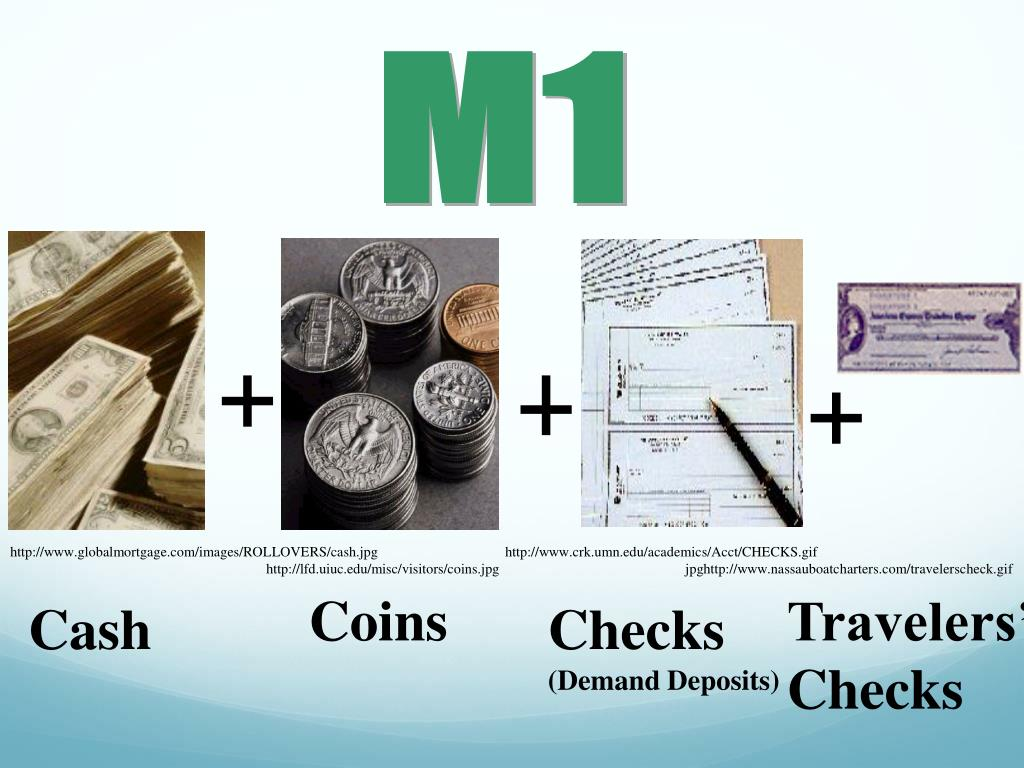
There are different measures of money supply used in this calculation, most commonly M1 and M2. M1 includes the most liquid forms of money, such as cash and checking deposits, while M2 includes M1 plus savings accounts and other near-money assets. The choice of which measure to use depends on the context and the specific economic analysis being conducted.
The velocity of money is influenced by several factors:
- Consumer and business confidence: When people feel optimistic about the economy, they are more likely to spend rather than save, increasing velocity.
- Interest rates: Higher interest rates can encourage saving and reduce spending, lowering velocity. Conversely, lower rates can stimulate borrowing and spending.
- Inflation expectations: If people expect prices to rise, they may spend more quickly, increasing velocity.
- Technological and structural changes: Innovations in digital payments and shifts in consumer behavior can also affect how quickly money moves.
Historically, the velocity of money has fluctuated with economic cycles. During periods of economic expansion, velocity tends to rise as spending increases. In contrast, during recessions or periods of uncertainty, velocity often falls as consumers and businesses hold onto cash. For instance, during the 2008 financial crisis and the early stages of the COVID-19 pandemic, velocity dropped sharply due to reduced consumer spending and increased saving.
In recent years, the U.S. has experienced persistently low velocity, even amid significant increases in the money supply. This phenomenon has puzzled economists and raised questions about the effectiveness of monetary policy. Despite aggressive stimulus measures, much of the new money has remained in savings or financial markets rather than circulating through the real economy.
Understanding the velocity of money is essential for policymakers. A low velocity may signal weak demand and justify expansionary fiscal or monetary policies. Conversely, a high velocity could indicate overheating and the need for tightening measures to prevent inflation.
In conclusion, the velocity of money is a dynamic indicator of economic vitality. It helps economists and central banks assess the flow of money, the strength of demand, and the potential for inflation.
While often overlooked by the public, it plays a vital role in shaping economic policy and understanding the broader health of the economy.
COMMENTS APPRECIATED
SPEAKING: Dr. Marcinko will be speaking and lecturing, signing and opining, teaching and preaching, storming and performing at many locations throughout the USA this year! His tour of witty and serious pontifications may be scheduled on a planned or ad-hoc basis; for public or private meetings and gatherings; formally, informally, or over lunch or dinner. All medical societies, financial advisory firms or Broker-Dealers are encouraged to submit an RFP for speaking engagements: CONTACT: Ann Miller RN MHA at MarcinkoAdvisors@outlook.com -OR- http://www.MarcinkoAssociates.com
Like, Refer and Subscribe
***
***
Share this:

Filed under: "Ask-an-Advisor", finance, Financial Planning, Funding Basics, Investing, Marcinko Associates, Portfolio Management, Touring with Marcinko | Tagged: Consumer Confidence, david marcinko, economics, economy, finance, GDP, inflation, interest rates, Investing, M1, M2, macroeconomics, money supply, money velocity | Leave a comment »