Is A Market Downside Ahead?
By Staff Reporters
***
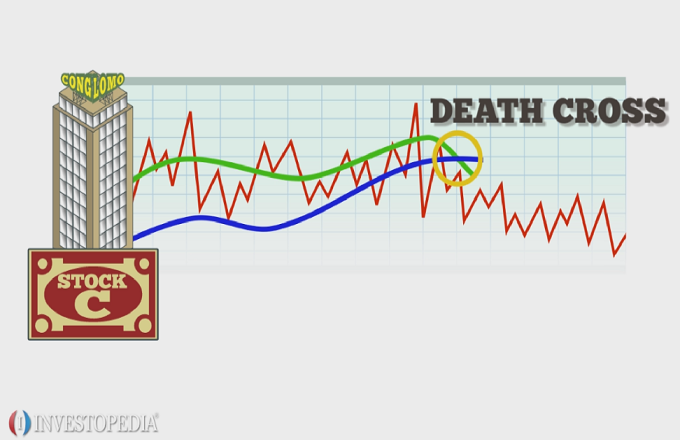
What Is a Death Cross?
The death cross is a technical chart pattern indicating the potential for a major sell-off. The death cross appears on a chart when a stock’s short-term moving average crosses below its long-term moving average. Typically, the most common moving averages used in this pattern are the 50-day and 200-day moving averages.
***
https://medicalexecutivepost.com/2022/02/09/what-is-a-bear-market-relief-rally/
CITE: https://www.r2library.com/Resource/Title/082610254
***
***
Summary:
- The death cross is a bearish signal that’s issued when the short term moving average penetrates the falling long term moving average from above.
- The most common settings for the averages are 50 and 200.
- The death cross is a lagging indicator, which should be taken into consideration before relying on it for your own investments
- MORE: https://www.msn.com/en-us/money/markets/the-stock-market-is-on-the-verge-of-flashing-a-death-cross-for-the-first-time-in-2-years-suggesting-more-downside-ahead/ar-AAUQaap?li=BBnbfcL
- RELATED: https://www.msn.com/en-us/money/markets/recession-coming-4-signs-pointing-to-a-major-market-downturn-in-2022/ar-AAUQkdn?li=BBnbfcL
***
COMMENTS APPRECIATED
Thank You
Subscribe to the Medical Executive-Post
***

***
***
Share this:

Filed under: Glossary Terms, Investing | Tagged: bear market, death cross, market sell-off, stock market death cross, stock moving averages | 2 Comments »