RICARDIAN ECONOMICS: Can it Save Medicine?

By Dr. David Edward Marcinko MBA MEd

***

***

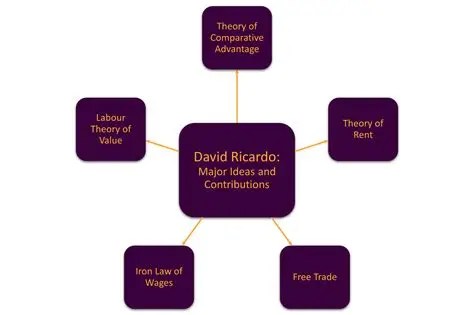
Ricardian economics, rooted in the theories of 19th-century economist David Ricardo, emphasizes comparative advantage, free trade, and the neutrality of government debt—most notably through the concept of Ricardian equivalence. While these ideas have shaped macroeconomic thought, their relevance to medicine and healthcare policy is less direct. Still, exploring Ricardian principles offers a provocative lens through which to examine the fiscal sustainability and efficiency of modern healthcare systems.

At the heart of Ricardian equivalence is the idea that consumers are forward-looking and internalize government budget constraints. If a government finances healthcare through debt rather than taxes, rational agents will anticipate future tax burdens and adjust their behavior accordingly. In theory, this undermines the effectiveness of deficit-financed healthcare spending as a stimulus. Applied to medicine, this suggests that long-term fiscal responsibility is crucial: expanding healthcare access through borrowing may not yield the intended economic or health benefits if citizens expect future costs to rise.

This insight could inform debates on healthcare reform, especially in countries grappling with ballooning medical expenditures. Ricardian economics warns against short-term fixes that ignore long-term fiscal implications. For example, expanding public insurance programs without sustainable funding mechanisms could lead to intergenerational inequities and economic distortions. Policymakers might instead focus on reforms that align incentives, reduce waste, and promote cost-effective care—principles that resonate with Ricardo’s emphasis on efficiency and comparative advantage.

***

***

However, Ricardian economics offers limited guidance on the unique moral and practical dimensions of medicine. Healthcare is not a typical market good. Patients often lack the information or autonomy to make rational choices, especially in emergencies. Moreover, the sector is rife with externalities: one person’s vaccination benefits the broader community, and untreated illness can strain public resources. These complexities challenge the assumption of rational, forward-looking behavior central to Ricardian equivalence.

Additionally, Ricardo’s theory of comparative advantage—where nations benefit by specializing in goods they produce most efficiently—has implications for global health. It supports international collaboration in pharmaceutical production, medical research, and telemedicine. Yet, over-reliance on global supply chains can expose vulnerabilities, as seen during the COVID-19 pandemic when countries faced shortages of critical medical supplies.

In conclusion, Ricardian economics provides valuable fiscal insights that can inform healthcare policy, particularly regarding debt sustainability and efficient resource allocation. Its emphasis on long-term planning and comparative advantage can guide reforms that make medicine more resilient and cost-effective. However, the theory’s assumptions about rational behavior and market dynamics limit its applicability to the nuanced realities of healthcare. Medicine requires not just economic efficiency but ethical considerations, equity, and compassion—areas where Ricardian economics falls short. Thus, while it can contribute to the conversation, it cannot “save” medicine alone.

COMMENTS APPRECIATED

EDUCATION: Books

SPEAKING: Dr. Marcinko will be speaking and lecturing, signing and opining, teaching and preaching, storming and performing at many locations throughout the USA this year! His tour of witty and serious pontifications may be scheduled on a planned or ad-hoc basis; for public or private meetings and gatherings; formally, informally, or over lunch or dinner. All medical societies, financial advisory firms or Broker-Dealers are encouraged to submit an RFP for speaking engagements: CONTACT: Ann Miller RN MHA at MarcinkoAdvisors@outlook.com 

Like, Refer and Subscribe

***

***

Macro-Economic Mid-Year Update

Join Our Mailing List

Last Week’s Headlines

By Michael Green [TGA Capital Management]

www.tgacapitalmanagement.com

Businesses are paying more for goods and services as the Producer Price Index increased 0.5% in June, the largest increase in a year, according to the Labor Department. Higher energy costs pushed the increase. Since businesses usually pass on increases in the cost of goods and services, it’s likely consumer prices will increase as well, driving inflation upward.

Here is a mid year economic summary:

  • In fact, consumer prices did increase in June–just not at quite the same rate as producer prices. The Consumer Price Index rose 0.2%, following the same increase in May and a 0.4% gain in April. Over the last 12 months, the CPI has increased 1.0%. Excluding the volatile food and energy components, consumer prices still increased 0.2% in June and 2.3% from a year earlier.
  • Consumers continue to spend as retail sales increased in June, jumping 0.6% from the previous month and 2.7% ahead of last June. This follows a 0.2% (downwardly revised) increase in May. Excluding autos and gas, household spending climbed 0.7% from May. Output excluding autos remained the same as the prior month. This report, coupled with increases in consumer and producer prices, provides optimism for the economy over the summer months.
  • The manufacturing sector experienced a noticeable uptick in June, as industrial production increased 0.6% after falling 0.3% in May. Manufacturing output rose 0.4%, largely due to an increase in motor vehicle assemblies. June’s gain is the largest monthly increase since November 2014.
  • The number of job openings decreased by 345,000 to 5.5 million on the last business day of May, according to the Job Openings and Labor Turnover Survey (JOLTS) report from the Bureau of Labor Statistics. April’s rate was 5.8 million. May’s job openings rate is the lowest of the year. The quits rate was unchanged at 2.0% as workers continue to remain at their present jobs. It’s important to remember that June’s employment situation report showed significant improvement on the labor front.
  • U.S. import prices rose 0.2% in June from May, largely due to a spike in petroleum prices. Exports also increased in June, rising 0.8% following increases of 1.2% in May and 0.4% in April. The 2.4% rise in export prices for the second quarter of 2016 was the largest three-month advance in export prices since the index rose 2.7% between February and May 2011.
  • The Treasury Department reported a $6.3 billion budgetary surplus in June, following May’s $52.5 billion deficit. However, over the first nine months of the fiscal year, the deficit is up almost 27%, at $400.9 billion, over the same period last year ($316.4 billion).
  • Largely influenced by the immediate negative impact of the Brexit vote, the Index of Consumer Sentiment fell from 93.5 in June to 89.5 in July.
  • In the week ended July 9, the advance figure for seasonally adjusted initial unemployment insurance claims remained level at 254,000, unchanged from the prior week’s level. The advance seasonally adjusted insured unemployment rate remained at 1.6%. The advance number for seasonally adjusted insured unemployment during the week ended July 2 was 2,149,000, an increase of 32,000 from the previous week’s revised level.

Conclusion

Your thoughts and comments on this ME-P are appreciated. Feel free to review our top-left column, and top-right sidebar materials, links, URLs and related websites, too. Then, subscribe to the ME-P. It is fast, free and secure.

Speaker: If you need a moderator or speaker for an upcoming event, Dr. David E. Marcinko; MBA – Publisher-in-Chief of the Medical Executive-Post – is available for seminar or speaking engagements. Contact: MarcinkoAdvisors@msn.com

OUR OTHER PRINT BOOKS AND RELATED INFORMATION SOURCES:

Comprehensive Financial Planning Strategies for Doctors and Advisors: Best Practices from Leading Consultants and Certified Medical Planners™

***

Macro-Economics and What the ‘Chained CPI’ Could Mean for Social Security?

Join Our Mailing List

Definition of Chain-Weighted CPI

By Dr. David Edward Marcinko MBA

Dr David E Marcinko MBAAn alternative BLS measurement for the Consumer Price Index (CPI), removing the biases associated with new products, changes in quality and discounted prices.

The chain weighted CPI incorporates the average changes in the quantity of goods purchased, along with standard pricing effects. This allows the chain weighted CPI to reflect situations where customers shift the weight of their purchases from one area of spending to another.

Read more: http://www.investopedia.com/terms/c/chain-linked-cpi.asp#ixzz2FdiMs25f

information

Investopedia Example:

The chain weighted CPI incorporates changes in both the quantities and prices of products. For example, let’s examine clothing purchases between two years. Last year you bought a sweater for $40 and two t-shirts at $35 each. This year, two sweaters were purchased at $35 each and one t-shirt for $45.

Standard CPI calculations would produce an inflation level of 13.64% 

((1 x 35 + 2 x 45)/ (1 x 40 + 2 x 35)) =1.1364

The chain weighted approach estimates inflation to be 4.55%

((2 x 35 + 1 x 45)/ (1 x 40 + 2 x 35)) =1.0455.

Using the chain weighted approach reveals the impact of a customer purchasing more sweaters than t-shirts.

Read more: http://www.investopedia.com/terms/c/chain-linked-cpi.asp#ixzz2FdiceVyv

BLS Application

  • What is the C-CPI-U and when did the Bureau of Labor Statistics (BLS) begin publishing it?

BLS began publishing the Chained Consumer Price Index for All Urban Consumers effective with the release of July 2002 CPI data. Designated the C-CPI-U, the index supplements the existing indexes already produced by the BLS: the CPI for All Urban Consumers (CPI-U) and the CPI for Urban Wage Earners and Clerical Workers (CPI-W).

The C-CPI-U employs a formula that reflects the effect of substitution that consumers make across item categories in response to changes in relative prices.

Read more: C-CPI-U data can be found on the BLS web site at http://data.bls.gov/cgi-bin/surveymost?su

Substitution Bias

  • What is substitution and substitution bias? And does the C-CPI-U eliminate it?

Traditionally, the CPI was considered an upper bound on a cost-of-living index in that the CPI did not reflect the changes in consumption patterns that consumers make in response to changes in relative prices.

Since January 1999, a geometric mean formula has been used to calculate most basic indexes within the CPI; this formula allows for a modest amount of substitution within item categories as relative price changes.

The geometric mean formula, though, does not account for consumer substitution taking place between CPI item categories. For example, pork and beef are two separate CPI item categories. If the price of pork increases while the price of beef does not, consumers might shift away from pork to beef. The C-CPI-U is designed to account for this type of consumer substitution between CPI item categories. In this example, the C-CPI-U would rise, but not by as much as an index that was based on fixed purchase patterns.

With the geometric mean formula in place to account for consumer substitution within item categories, and the C-CPI-U designed to account for consumer substitution between item categories, any remaining substitution bias would be quite small.

Assessment 

Link: What ‘chained CPI’ could mean for Social Security

White Paper: http://www.bls.gov/cpi/super_paris.pdf

Conclusion

Your thoughts and comments on this ME-P are appreciated. Feel free to review our top-left column, and top-right sidebar materials, links, URLs and related websites, too. Then, subscribe to the ME-P. It is fast, free and secure.

Link: http://feeds.feedburner.com/HealthcareFinancialsthePostForcxos

Speaker: If you need a moderator or speaker for an upcoming event, Dr. David E. Marcinko; MBA – Publisher-in-Chief of the Medical Executive-Post – is available for seminar or speaking engagements. Contact: MarcinkoAdvisors@msn.com

Our Other Print Books and Related Information Sources:

Health Dictionary Series: http://www.springerpub.com/Search/marcinko

Practice Management: http://www.springerpub.com/product/9780826105752

Physician Financial Planning: http://www.jbpub.com/catalog/0763745790

Medical Risk Management: http://www.jbpub.com/catalog/9780763733421

Hospitals: http://www.crcpress.com/product/isbn/9781439879900

Physician Advisors: www.CertifiedMedicalPlanner.org

Product DetailsProduct DetailsProduct Details

Product Details  Product Details

Product Details

Understanding the Money Supply as a Percentage of GDP

Join Our Mailing List

By Country for our Domestic and International ME-P Readers

By Staff Reporters

There’s a lot of money in the world, but not all of it can be easily defined as “money.” Just where the money is and who has it is a complicated issue. The wad of money in your pocket is one form of money, but the money supply is hardly limited to that. So, where is the money and what exactly is it?

Finding Out

To find out what Broad Money, Money Zero Maturity, the Monetary Base, and Money and Close Substitutes mean, take a look at the graphic for an explanation. You’ll see that there is a lot more to money than you may have realized. The cash you use from day to day is M0, but there are also MB, M1, M2, M3 and more.

What Is Quasi Money?

If you want to measure how much money a country has, there is much more to consider than just how much printed money is within that country. If you think about how much money you have, it’s likely a lot more than just the cash you have on hand. You have bank accounts, checks and other forms of money that factor into how much money you have. The same is true for countries.

By Country

How much money a country can get pretty complicated, but there is a way to figure out each country’s quasi money. No, this doesn’t mean fake money or “sort of” money, like the name may imply. Quasi money may also sound like our paychecks these days, but what it refers to is actually a pretty neat assessment of the money that a country really has.

The money supply of every single country can be measured accurately by looking at a number of different things. To find out exactly what goes into the money that a country has, take a look at the graphic.

How Does Your Country Stack Up?

How does your country compare to other countries in terms of money? The amount of quasi money in each country when measured as a percentage of a country’s Gross Domestic Product (GDP) is pretty telling. Check out the graphic to see how your country rates and whether it makes the top 10, the bottom 10 or falls somewhere in the middle. If you know someone from a country on the top or bottom lists, forward the graphic to them and let them know about it. Depending on where their country falls, it may be time to gloat or to pretend not to be jealous.

Where are the top and bottom countries located?

Are they countries that are typically thought of as being rich and poor, or do they come straight out of left field for a sneak attack? There are certainly some countries in there that will surprise you as well as some that won’t. Take a look for yourself and see where the wealth of the world lies.

Conclusion

Your thoughts and comments on this ME-P are appreciated. Feel free to review our top-left column, and top-right sidebar materials, links, URLs and related websites, too. Then, subscribe to the ME-P. It is fast, free and secure.

Link: http://feeds.feedburner.com/HealthcareFinancialsthePostForcxos

Speaker: If you need a moderator or speaker for an upcoming event, Dr. David E. Marcinko; MBA – Publisher-in-Chief of the Medical Executive-Post – is available for seminar or speaking engagements. Contact: MarcinkoAdvisors@msn.com

Our Other Print Books and Related Information Sources:

Health Dictionary Series: http://www.springerpub.com/Search/marcinko

Practice Management: http://www.springerpub.com/product/9780826105752

Physician Financial Planning: http://www.jbpub.com/catalog/0763745790

Medical Risk Management: http://www.jbpub.com/catalog/9780763733421

Hospitals: http://www.crcpress.com/product/isbn/9781439879900

Physician Advisors: www.CertifiedMedicalPlanner.org

Product Details  Product Details