By Staff Reporters
SPONSOR: http://www.CertifiedMedicalPlanner.org
***
***
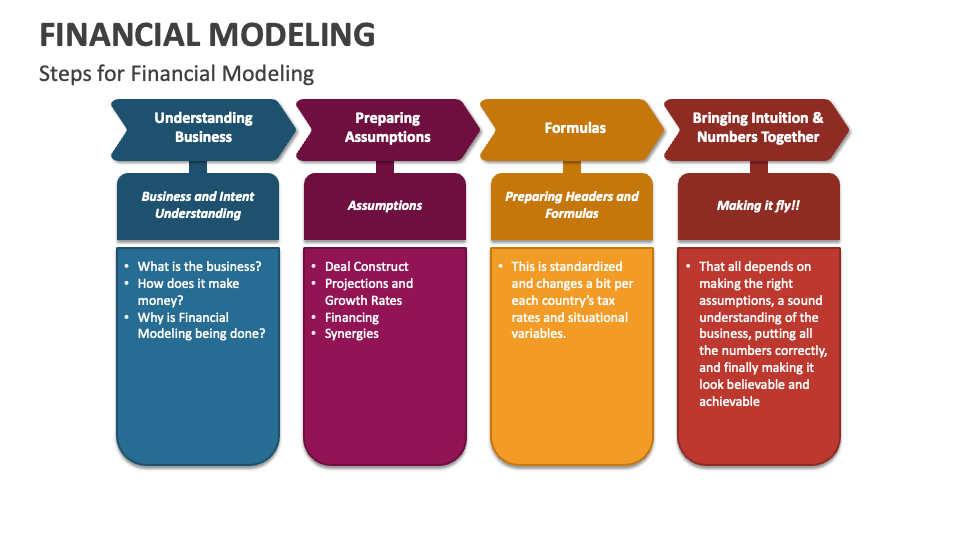
Financial Modeling is one of the most highly valued, but thinly understood, skills in financial analysis. The objective of financial modeling is to combine accounting, finance, and business metrics to create a forecast of a company’s future results.
According to Jeff Schmidt, a financial model is simply a spreadsheet, usually built in Microsoft Excel, that forecasts a business’s financial performance into the future. The forecast is typically based on the company’s historical performance and assumptions about the future and requires preparing an income statement, balance sheet, cash flow statement, and supporting schedules (known as a three-statement model, one of many types of approaches to financial statement modeling). From there, more advanced types of models can be built such as discounted cash flow analysis (DCF model), leveraged buyout (LBO), mergers and acquisitions (M&A), and sensitivity analysis
***
DEFINED TERMS
Discounted Cash Flow (DCF): A valuation method used to estimate the value of an investment based on its expected future cash flows, adjusted for the time value of money. It’s like deciding whether a treasure chest is worth diving for now, based on the gold coins you’ll be able to cash in later.
Sensitivity Analysis: This involves changing one variable at a time to see how it affects an outcome. Imagine tweaking your coffee-to-water ratio each morning to achieve the perfect brew strength.
Budget – A budget is the amount of money a department, function, or business can spend in a given period of time. Usually, but not always, finance does this annually for the upcoming year.
Rolling Forecast – A rolling forecast maintains a consistent view over a period of time (often 12 months). When one period closes, finance adds one more period to the forecast.
Topside – A topside adjustment is an overlay to a forecast. This is typically completed by the corporate or headquarter team. As individual teams submit a forecast, the consolidated result might not make sense or align with expectations. When this occurs, the high-level teams use a topside adjustment to streamline or adjust the consolidated view.
Monte Carlo Simulation: Picture yourself at the casino, but instead of gambling your savings away, you’re using this technique to predict different outcomes of your business decisions based on random variables. It’s like playing financial roulette with the odds in your favor.
What-If Analysis: Ever daydream about what would happen if you took that leap of faith with your business? This tool allows you to explore various scenarios without risking a dime. It’s like trying on outfits in a virtual dressing room before making a purchase.
Leveraged Buyout (LBO) Model: This is a bit like orchestrating a heist, but legally. It’s about acquiring a company using borrowed money, with plans to pay off the debts with the company’s own cash flows. High stakes, high rewards.
Mergers and Acquisitions (M&A) Model: Picture two puzzle pieces coming together. This model evaluates how combining companies can create a new, more valuable entity. It’s the corporate version of a matchmaker.
Three Statement Model: The holy trinity of financial modeling, linking the income statement, balance sheet, and cash flow statement. It’s like weaving a tapestry where each thread is crucial to the overall picture.
Capital Asset Pricing Model (CAPM): A formula that calculates the expected return on an investment, considering its risk compared to the market. It’s like choosing the best roller coaster in the park, balancing thrill and safety.
Cash Flow Forecasting: This is your financial weather forecast, predicting the cash flow climate of your business. It helps you plan for sunny days and save for the rainy ones.
Cost of Capital: The price of financing your business, whether through debt or equity. It’s like the interest rate on your growth engine, pushing you to maximize every dollar invested.
Debt Schedule: A timeline of your business’s debts, showing when and how much you owe. It’s your roadmap to becoming debt-free, one milestone at a time.
Equity Valuation: Determining the value of a company’s shares. It’s like assessing the worth of a rare gemstone, ensuring investors pay a fair price for a piece of the treasure.
Financial Leverage: Using debt to amplify returns on investment. It’s like using a lever to lift a heavy object, increasing force but also risk.
Forecast Model: A crystal ball for your finances, projecting future performance based on past and present data. It’s your guide through the financial wilderness, helping you navigate with confidence.
Operating Model: A detailed blueprint of how a business generates value, mapping out operational activities and their financial impact. It’s like laying out the inner workings of a clock, ensuring every gear turns smoothly.
Revenue Growth Model: This tracks potential increases in sales over time, charting a course for expansion. It’s like plotting your ascent up a mountain, anticipating the effort required to reach the summit.
COMMENTS APPRECIATED
Subscribe, Like, Refer and Learn
***
***
Share this:

Filed under: "Advisors Only", "Ask-an-Advisor", "Doctors Only", Accounting, CMP Program, Experts Invited, Financial Planning, Funding Basics, Glossary Terms, Health Economics, Healthcare Finance, Investing, Touring with Marcinko | Tagged: Accounting, balance sheet, budget, budgeting, business, CAPM, cash flow, certified medical planner, CFI, CMP, DCF, DO, doctors, DPM, economics, equity, excel, finance, financial modeling, financial modeling terms, income statement, Investing, jeff schmidt, KPI, LBO, leverage, M&A, Marcinko, MD, metrics, Michael Dion, Monte Carlo, MSFT, numbers, operating model, physicians, revenue growth, stocks, valuation | Leave a comment »