On The Next Stock Market Correction?

Join Our Mailing List

Remember the Ace Up Your Sleeve!

By Lon Jefferies MBA CFP® CMP®

Lon JeffriesAfter the historic growth the stock market has experienced since early 2009, many physician investors have felt that a healthy pullback may not be a completely negative thing.

After all, we certainly don’t want another bubble, or stock prices that are clearly out of line with the earning potential of the underlying companies.

Unfortunately, market corrections never feel healthy when they occur. Physicians, investors and almost all people get uncomfortable when the market declines, the media fans the flames by giving investors reason after reason to be afraid, and worries that this is the beginning of the next crash begin to develop.

While many investors admit that a 5% pullback is manageably unpleasant, concerns expand when the market decline hits 10% — right when the media can officially throw around the word “correction.”

Of course, we have no idea when the next drop will occur, but why not mentally prepare ourselves by exploring what has traditionally happened to stock prices once that 10% decline is crossed?

The Data

Ben Carlson, an institutional investment portfolio manager, looked at the S&P data going back to 1950, and found that there have been 28 instances when stocks fell by 10% or more. Thus, on average, the market has entered an official correction every 2.25 years. The last market correction occurred in 2011, so another 10% drop at this time would correlate pretty close to the average amount of time between corrections.

Obviously, the market has done pretty well since that last temporary correction in 2011. Clearly, such a drop is quite normal and far from historically concerning.

  • S&P 500 Losses of 10% or More Since 1950
  • Total Occurrences: 28 Times
  • Average Loss: -21.6%
  • Median Loss: -16.5%
  • Average Length: 7.8 Months
  • Greater Than 20% Loss: 9 Times
  • Greater Than 30% Loss: 5 Times
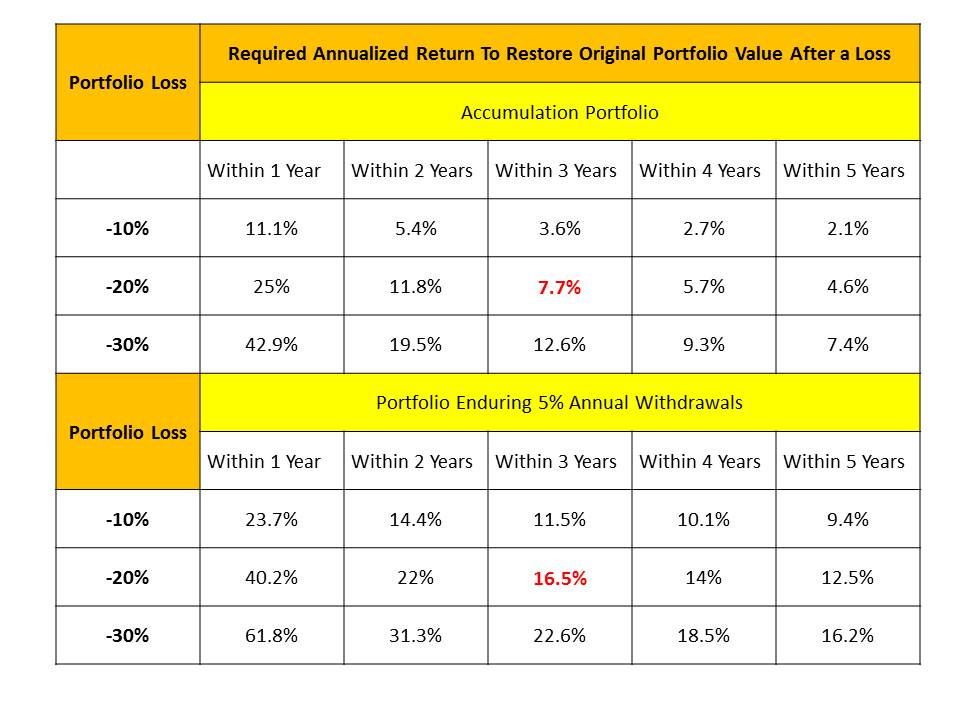
Your Advantage

Are you thinking “I don’t think I can stomach that median loss of 16.5%?” Then it’s time to pull out the ace up your sleeve. Remember that the data above represents the historical performance of the S&P 500 – an index that is composed of 100% stocks. A capable financial planner would ensure you have an asset allocation mix between stocks, bonds, and cash that represents your tolerance for risk.

Consequently, your portfolio likely isn’t 100% stocks. In fact, the appropriate allocation for an average investor approaching or already enjoying retirement might be closer to only 50% stocks. This means that on average, your portfolio should decline only half as much as the S&P 500 during market downturns.

This ace may bring the loss endured by our sample investor with a 50% stock portfolio down to around 8.25% during the median decline. Are you now back in the “manageably unpleasant” range? If so, you likely have an appropriately constructed portfolio. If not, your risk tolerance may need to be reevaluated to ensure you are not exposing your nest egg to a larger loss than you can endure.

Avoid Harmful Reactions to the Market

Although the recent market pullback produces what seems like a foreign feeling, we’ve been here before. The S&P 500 declined in value by 18.64% over a 5 month period in 2011. However, an investor with a 50% stock portfolio likely only saw their account values drop around 9%-10% — still not fun, but manageable.

Assessment

Of course, we don’t know whether the market will continue to bounce back or again drop into official correction territory. If you continue to hear about the broad markets declining, remember that the average historical correction has been far from catastrophic, and that you have the ace of an appropriate asset allocation up your sleeve.

Financial Planning MDs 2015

Comprehensive Financial Planning Strategies for Doctors and Advisors: Best Practices from Leading Consultants and Certified Medical Planners™

Conclusion

Your thoughts and comments on this ME-P are appreciated. Feel free to review our top-left column, and top-right sidebar materials, links, URLs and related websites, too. Then, subscribe to the ME-P. It is fast, free and secure.

Speaker: If you need a moderator or speaker for an upcoming event, Dr. David E. Marcinko; MBA – Publisher-in-Chief of the Medical Executive-Post – is available for seminar or speaking engagements. Contact: MarcinkoAdvisors@msn.com

OUR OTHER PRINT BOOKS AND RELATED INFORMATION SOURCES:

Product Details  Product Details

How Have Bonds Responded to Higher Interest Rates?

Join Our Mailing List 

A Survey of Economists

By Lon Jefferies MBA CFP™

Lon JeffriesRecently, I pondered the possibility of interest rates rising and the impact it might have on bonds. The article was motivated by a Wall Street Journal survey of 50 top economists who forecasted the yield on the 10-year Treasury bond to rise to 3.47% by the end of 2014.

As you may know, the investment return of existing bonds tends to move inversely to interest rates. Consequently, there has been significant concern that bond values are due for a considerable drop, and investors have constantly questioned whether they should reduce their exposure to fixed-income investments.

The Forecast Results

So how has the economists’ forecast panned out through January? The 10-year Treasury bond began the year at 3.03%, but ended January at 2.65% — a significant decline.

As a result, bonds have generally increased in value. For instance, the iShares Investment Grade Corporate Bond ETF (LQD) is up 1.88% since the New Year, while the iShares Barclays 7-10 Year Treasury Bond (IEF) is up 3.06%. Even the SPDR Barclays International Treasury Bond ETF (BWX) is up .45% in 2014.

Why?

What has caused this unexpected result?

First, the historical inaccuracy of interest rate forecasts is well documented. A study by the University of North Carolina found economists predict future rates far less accurately than a random coin flip would fare as a predictor. Rising interest rates have been a general expectation since shortly after the market crash of 2008. Remember all the people who refinanced their homes away from an adjustable-rate mortgage to a fixed mortgage from 2010-2011 out of fear of rising rates? That rate hike still hasn’t come.

But, more important than the unpredictable nature of interest rates is the way bond performance has historically been related to the stock market’s performance.

In difficult market environments, the investment returns of stocks and bonds tend to have an inverse relationship. In fact, the S&P 500 (a broad measure of the U.S. stock market) has decreased in value during a calendar year five times since 1990 (1990, 2000, 2001, 2002, 2008). In all five instances, the value of U.S. Government Bonds (as measured by the Barclays Long-Term Government Bond Index) has increased (6.29%, 20.28%, 4.34%, 16.99%, and 22.69%, respectively).

RISK

Performance of Equities

How have risky stocks performed in 2014? The S&P 500 is down -3.46%, the Dow Jones Developed Market ex-U.S. market index (a measure of international stock performance) is down -3.64%, and the iShares MSCI Emerging Markets Index is down -8.63%.

It appears investors have fled stocks in a declining market and sought solace in the fixed income benefit that bonds provide, in-step with historic behavioral norms. Of course, higher demand for bonds means higher values. This last month has been a nice reminder of the stability bonds can add to a portfolio in a time of declining stock prices.

Assessment

While it is reasonable to expect interest rates to rise by some measure over the long-term, it would clearly be a mistake to dramatically shift your asset allocation away from bonds if they were determined to be a part of an investment portfolio that matches your risk tolerance.

January 2014 illustrated that bonds tend to increase in value and add benefit to a portfolio during market pullbacks, regardless of what interest rates are doing. In fact, bonds’ historical inverse relationship with stocks may be a larger determinate of performance than interest rate expectations.

More:

Conclusion

Your thoughts and comments on this ME-P are appreciated. Feel free to review our top-left column, and top-right sidebar materials, links, URLs and related websites, too. Then, subscribe to the ME-P. It is fast, free and secure.

Link: http://feeds.feedburner.com/HealthcareFinancialsthePostForcxos

Speaker: If you need a moderator or speaker for an upcoming event, Dr. David E. Marcinko; MBA – Publisher-in-Chief of the Medical Executive-Post – is available for seminar or speaking engagements. Contact: MarcinkoAdvisors@msn.com

OUR OTHER PRINT BOOKS AND RELATED INFORMATION SOURCES:

DICTIONARIES: http://www.springerpub.com/Search/marcinko
PHYSICIANS: www.MedicalBusinessAdvisors.com
PRACTICES: www.BusinessofMedicalPractice.com
HOSPITALS: http://www.crcpress.com/product/isbn/9781466558731
CLINICS: http://www.crcpress.com/product/isbn/9781439879900
BLOG: www.MedicalExecutivePost.com
FINANCE: Financial Planning for Physicians and Advisors
INSURANCE: Risk Management and Insurance Strategies for Physicians and Advisors

Product Details  Product Details

Is a Stock Market Correction Imminent?

Join Our Mailing List

Destined for a significant pullback; or not!

By Lon Jefferies MBA CFP® http://www.NewWorthAdvice.com

Lon JefferiesThe market has allowed itself a well-deserved “cool down” period during the month of August. The S&P 500 was down 3.13% while the Dow Jones Industrial Average was down 4.45% for the month.

After Running of the Bulls

After the roaring bull market we’ve enjoyed since April 2009, it is natural for investors to question whether this is a turning point and the market is destined for a significant pullback.

Currently, it is valuable to remind ourselves that even through the woes of August, the S&P 500 is only down 4.5% from its recent all-time high.

Wall Street Writes

Additionally, it is useful to define some terms, as Josh Brown, one of my favorite Wall Street writers, recently did:

Percentage    Drop: Defined    As: Feels    Like:
less than   5% Pause “whatever”
5% to 10% Dip Refreshing
10%+ Correction Nerve-wracking
20%+ Bear Market Panic
50%+ Crash Can’t Get   Out of Bed

The Market Pause

You may have heard the word correction in the financial media lately. With a market pause still under 5%, it’s probably a bit early to start talking about a correction. Still, let’s assume we are headed for an actual correction, or a loss of 10% to 20%.

Expectations

What should we expect? Here are some interesting numbers that Mr. Brown accumulated:

  • Since the end of World War II (1945), there have been 27 corrections of 10% or more. Only 12 of these corrections evolved into bear markets (a loss of 20%+). The average decline during these 27 episodes has been 13.3% and they’ve taken an average of 71 trading days to play out.
  • On average, the market has endured a correction every 20 months. Of course, the corrections aren’t evenly spaced out — 25% of the corrections occurred during the 1970′s, and another 20% occurred during the secular bear market of 2000-2010. However, from 1982 through 2000, there was just four corrections of 10% or more. This is relevant as it illustrates that bull markets can run for a long time without a lot of drama.
  • Since the stock market’s bottom in March of 2009, there have been two corrections. In the spring of 2010 the S&P 500 lost 16% over 69 trading days. In the summer of 2011, the S&P 500 dropped a hair over 20% before snapping back. Technically, this qualified as a bear market, which would mean the current rally is only two years old as opposed to almost five years old if dated from March of 2009.
  • The market pulled back 9.9% during 60 days in the summer of 2012. While not quite a correction, this dip set up one of the greatest rallies of all time.
  • There have been 58 bull market rallies (defined as market advances of 20% or more) in the post-war period, and they have run for an average of 221 trading days and resulted in an average gain of 32%. Comparatively, when measured by both length and magnitude, the current bull market is overdue for a correction and has been for awhile.

###

Stock_Market

###

Financial Action Plan

So what should you do assuming we are heading for a correction?

First, it is critical to remind yourself that if you are following sound financial planning principals, you already have an investment portfolio that matches your risk tolerance and investment time horizon.

Remember that just because the market loses 10% doesn’t mean your portfolio will lose 10%. In fact, if you scaled back the assertiveness of your portfolio as you transitioned into retirement and your portfolio is only 60% stocks, your portfolio would likely only be down approximately 6%.

Second, in the instance of an investor with a portfolio that is 60% equities, recall that you selected such a portfolio because you deemed a 6% loss to be acceptable. In fact, if due diligence was completed when you selected an asset allocation, you were aware that the largest loss a 60% stock, 40% bond portfolio suffered during the last 44 years was -19.35% (2008).

Additionally, you were aware that such a loss could (and likely would) happen again and you determined that was acceptable.

Grinding Teeth

Thus, for medical professionals and other investors who have done their planning, the best thing to do in the event of a market correction is grit your teeth and do very little!

For those doctors who haven’t planned in advance, now would be an ideal time to do your homework and create a portfolio that matches your situation and behavior patterns.

Assessment

Once you’ve done your planning, all you need to do is remember what Josh Brown calls the ABCs of investing: Always Be Cool.

Conclusion

Your thoughts and comments on this ME-P are appreciated. Feel free to review our top-left column, and top-right sidebar materials, links, URLs and related websites, too. Then, subscribe to the ME-P. It is fast, free and secure.

Link: http://feeds.feedburner.com/HealthcareFinancialsthePostForcxos

Speaker: If you need a moderator or speaker for an upcoming event, Dr. David E. Marcinko; MBA – Publisher-in-Chief of the Medical Executive-Post – is available for seminar or speaking engagements. Contact: MarcinkoAdvisors@msn.com

OUR OTHER PRINT BOOKS AND RELATED INFORMATION SOURCES:

DICTIONARIES: http://www.springerpub.com/Search/marcinko
PHYSICIANS: www.MedicalBusinessAdvisors.com
PRACTICES: www.BusinessofMedicalPractice.com
HOSPITALS: http://www.crcpress.com/product/isbn/9781466558731
CLINICS: http://www.crcpress.com/product/isbn/9781439879900
BLOG: www.MedicalExecutivePost.com
FINANCE: Financial Planning for Physicians and Advisors
INSURANCE: Risk Management and Insurance Strategies for Physicians and Advisors

Product DetailsProduct DetailsProduct Details

Product Details  Product Details

What Happens if the Stock Market Crashes – Doctor?

Join Our Mailing List

There is No Investing Crystal Ball

Lon JeffriesBy Lon Jefferies, MBA CFP CMP™

As the Dow has risen greatly since March 9, 2009, some physicians and investors worry that the market is overheated and due for a severe pullback; as recently experienced very minor events have illustrated.

But, an opposing view is that the current price of the S&P 500 is comparable to its value in 1999, despite the fact that its earnings and dividends have doubled since that time, and suggesting the market has additional room to grow.

The Future is UnKnown

There is no crystal ball. What the stock market will do in the near future is anyone’s guess. As uncertainty is always a factor when investing, developing a portfolio that represents your risk tolerance and investment time horizon is critical.

Many physicians and investors realize they need to scale back the assertiveness of their portfolio as they approach retirement, but why is this important? The mechanics of an investment portfolio are very different for a portfolio in the distribution phase than for a portfolio still accumulating assets. If an investor is taking withdrawals from their account, it is much more difficult to recover from losses because distributions only serve to exacerbate the market decline.

crystalball2

Dr. Israelsen Speaks

As Craig Israelsen PhD points out in the February 2013 issue of Financial Planning Magazine with the following illustration, a portfolio enduring annual 5% withdrawals faces a much steeper climb back to break even after a loss than does an accumulation portfolio:

Clearly, the conclusion is if you are taking distributions from your account, or intend to do so soon, it is vitally important to avoid large losses. As it may be realistic for investors still accumulating assets to recover from a -20% loss by obtaining an average annualized return of 7.7% for three years, it is unlikely that a retiree taking distributions from his account will get the 16.5% annual return required for three years in order to recover from a similar loss.

Diversify

Protect yourself from unsustainable losses by maintaining adequate diversification within your portfolio. Bonds serve as a buffer against volatility and will likely decrease your loss during stock market corrections.

Additionally, ensure your portfolio has sufficient exposure to various asset classes: large cap, mid cap, and small cap stocks; US, international, and emerging market stocks; government, corporate, international, and emerging market bonds. Investing in multiple asset categories will protect your portfolio from a catastrophic loss next time a bubble in a market sector pops.

chart

Assessment

Speak with a Certified Medical Planner™ or fiduciary and physician focused financial advisor to ensure your portfolio is assertive enough to meet your retirement goals while maintaining an acceptable level of risk. If you wait for the market to turn before taking action, it may be too late.

www.CertifiedMedicalPlanner.org

Conclusion

Your thoughts and comments on this ME-P are appreciated. Feel free to review our top-left column, and top-right sidebar materials, links, URLs and related websites, too. Then, subscribe to the ME-P. It is fast, free and secure.

Link: http://feeds.feedburner.com/HealthcareFinancialsthePostForcxos

Speaker: If you need a moderator or speaker for an upcoming event, Dr. David E. Marcinko; MBA – Publisher-in-Chief of the Medical Executive-Post – is available for seminar or speaking engagements. Contact: MarcinkoAdvisors@msn.com

***

Risk Management, Liability Insurance, and Asset Protection Strategies for Doctors and Advisors: Best Practices from Leading Consultants and Certified Medical Planners™8Comprehensive Financial Planning Strategies for Doctors and Advisors: Best Practices from Leading Consultants and Certified Medical Planners™