BOARD CERTIFICATION EXAM STUDY GUIDES Lower Extremity Trauma
[Click on Image to Enlarge]
ME-P Free Advertising Consultation
The “Medical Executive-Post” is about connecting doctors, health care executives and modern consulting advisors. It’s about free-enterprise, business, practice, policy, personal financial planning and wealth building capitalism. We have an attitude that’s independent, outspoken, intelligent and so Next-Gen; often edgy, usually controversial. And, our consultants “got fly”, just like U. Read it! Write it! Post it! “Medical Executive-Post”. Call or email us for your FREE advertising and sales consultation TODAY [678.779.8597] Email: MarcinkoAdvisors@outlook.com
Medical & Surgical e-Consent Forms
ePodiatryConsentForms.com
iMBA Inc., OFFICES
Suite #5901 Wilbanks Drive, Norcross, Georgia, 30092 USA [1.678.779.8597]. Our location is real and we are now virtually enabled to assist new long distance clients and out-of-town colleagues.
ME-P Publishing
SEEKING INDUSTRY INFO PARTNERS?
If you want the opportunity to work with leading health care industry insiders, innovators and watchers, the “ME-P” may be right for you? We are unbiased and operate at the nexus of theoretical and applied R&D. Collaborate with us and you’ll put your brand in front of a smart & tightly focused demographic; one at the forefront of our emerging healthcare free marketplace of informed and professional “movers and shakers.” Our Ad Rate Card is available upon request [678-779-8597].
Posted on June 30, 2025 by Dr. David Edward Marcinko MBA MEd CMP™
By AI
CBOE Volatility Index
***
***
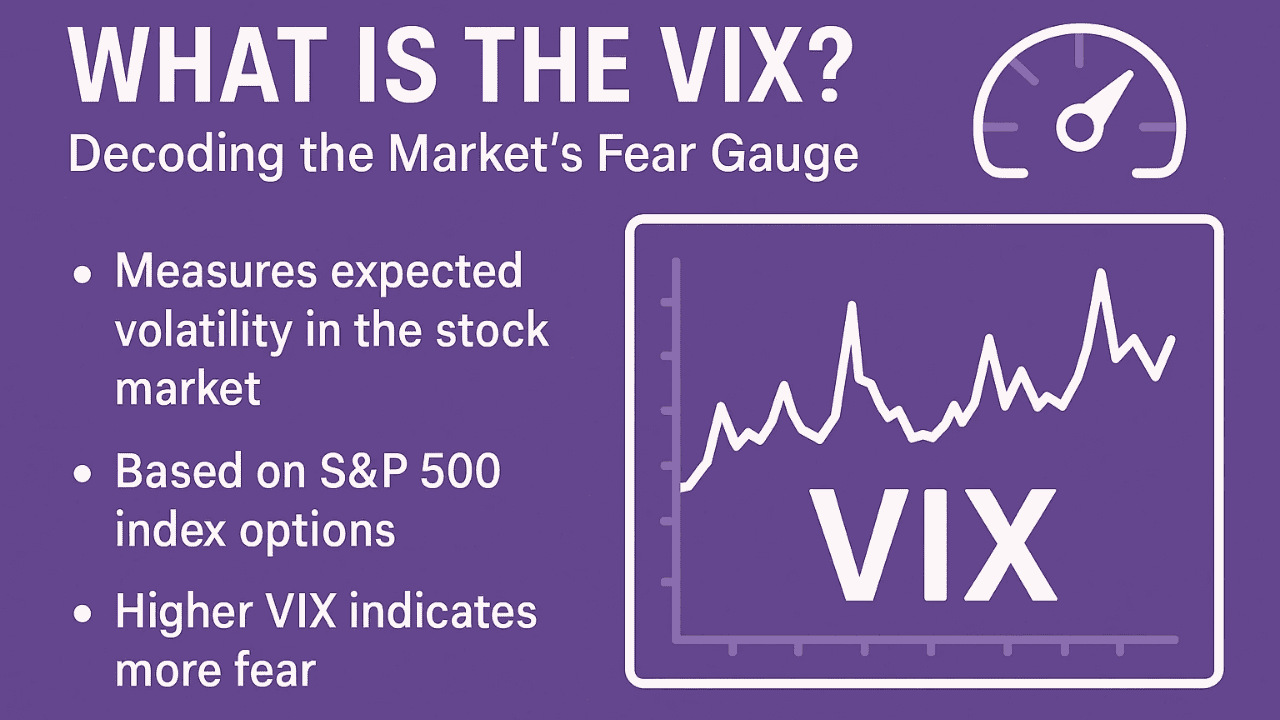
There’s a lot of confidence in markets these days, and nowhere is that more apparent than in the VIX, aka the CBOE Volatility Index, aka aka the Fear Index.
According to Brew Markets, the VIX literally measures the market’s expectation of volatility based on S&P 500 index options, but it’s become a shorthand way of quantifying investors’ fear or confidence. Any time the VIX rises above 30, it’s taken as a sign of some serious trepidation in the market—but anytime it falls below 20, the market is calm, cool, and collected.
The VIX skyrocketed to over 50 on Liberation Day as investors fretted over what tariffs meant for their portfolios, but it’s been gradually falling ever since. As the chart above shows, the VIX just fell below its key support level of 17—a mark it has failed to break below recently, and a move that underlines investors’ confidence that the good times will keep rolling.
The VIX soared to 60.13 last Monday before plummeting all the way to 33.76 on Wednesday, the day after the president paused tariffs. But while the VIX has since settled down a bit, investor fear is still high. The VIX closed above 30 for 10 straight trading sessions and the last time that happened was during the bear market back in October 2022, according to MarketWatch—not exactly a comforting comparison.
Then again, just because fear skyrocketed last week doesn’t mean the markets will tank in turn. “Since 1997, there have been 11 times the VIX spiked above 45—and 10 out of 11 times, the S&P 500 was higher four months later by an average of +6.4%,” noted Austin Hankowitz in the latest edition of the Rich Habits newsletter.
Finally, the VIX closed above 30 Thursady as tariff talk and monetary policy pivots keep investors on their toes. But while worries might keep investors on the sidelines, some on Wall Street are taking this opportunity to be greedy while others are fearful.
Posted on August 6, 2024 by Dr. David Edward Marcinko MBA MEd CMP™
MEDICAL EXECUTIVE-POST–TODAY’SNEWSLETTERBRIEFING
***
Essays, Opinions and Curated News in Health Economics, Investing, Business, Management and Financial Planning for Physician Entrepreneurs and their Savvy Advisors and Consultants
“Serving Almost One Million Doctors, Financial Advisors and Medical Management Consultants Daily“
A Partner of the Institute of Medical Business Advisors , Inc.
A federal judge ruled that Google engaged in illegal practices to preserve its search engine monopoly, delivering a major antitrust victory to the Justice Department in its effort to rein in Silicon Valley technology giants. Google, which performs about 90 percent of the world’s internet searches, exploited its market dominance to stomp out competitors, U.S. District Judge Amit P. Mehta said in the long-awaited ruling.
Stat: $900 billion. That’s the potential market value loss of the Magnificent Seven tech companies as investors shed tech stocks. The selloff comes as investors are looking for safer bets in the event of a recession. (Reuters)
The S&P 500 index tanked 160.23 points (–3.00%) to 5,186.33; the Dow Jones Industrial Average® ($DJI) plunged 1,033.99 points (–2.60%) to 38,703.27; the NASDAQ Composite plummeted 576.08 points (–3.43%) to 16,200.08.
The 10-year Treasury note yield (TNX) dropped to 3.78%, the lowest close since June 2023.
The CBOE Volatility Index® (VIX) ended at 37.04, a four-year high but well-off intraday peaks above 60.
Today, the VIX reached levels not seen since early 2020 during the pandemic panic. This type of volatility can suggest oversold conditions. A higher VIX, sometimes called the “fear index,” reflects uncertainty and can suggest quicker, more intense market swings.
What’s up
Kellanova popped 16.23% on a report that the company is preparing to be acquired by fellow snackfoods maker Mars.
Apple stumbled 4.82% after Warren Buffett’s Berkshire Hathway revealed it has cut its position in the tech company by nearly 50%.
Nvidia fell 6.36% after a report this weekend revealed that its brand new chips will be delayed by three months or more due to design flaws.
Tesla sank 4.23% due to concerns about the auto maker’s global growth, despite Elon Musk’s recent positivity.
Intel continued to crumble, sliding 6.38% as the after-effects of its terrible second-quarter earnings report continue to be felt.
Bitcoin-related stocks plummeted today as cryptocurrencies were unable to avoid a major selloff. Coinbase plunged 7.32%, while MicroStrategy dropped 9.60%, and even Robinhood tumbled 8.17%.
Visualize: How private equity tangled banks in a web of debt, from the Financial Times.
Posted on July 2, 2022 by Dr. David Edward Marcinko MBA MEd CMP™
By Staff Reporters
***
The market is made up of thousands of stocks. And on any given day, investors are actively buying and selling them. This measure looks at the amount, or volume, of shares on the NYSE that are rising compared to the number of shares that are falling.
The formula: Breadth Line Value= (No.of Advance Stocks – No of Decline Stocks) + Breadth Line Value of the Previous day. When the number of advance stocks exceeds the number of the decline stocks then the breadth line will rise and vice versa.
Posted on June 4, 2022 by Dr. David Edward Marcinko MBA MEd CMP™
By Staff Reporters
***
***
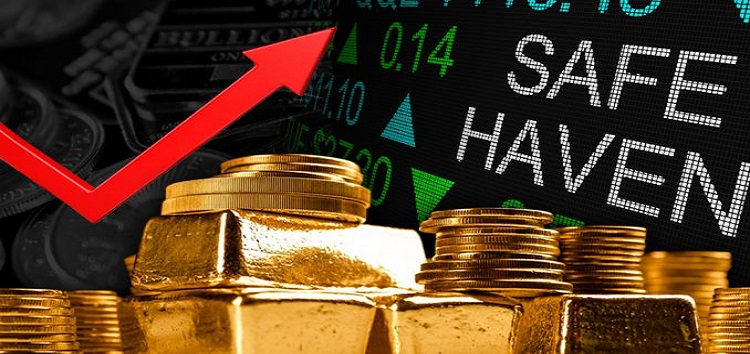
Stocks are riskier than bonds. But the reward for investing in stocks over the long haul is greater. Still, bonds can outperform stocks over short periods. Safe Haven Demand shows the difference between Treasury bond and stock returns over the past 20 trading days.
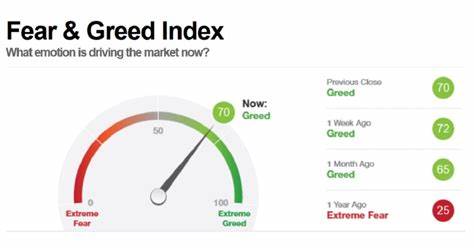
Bonds do better when investors are scared. The Fear & Greed Index uses increasing safe haven demand as a signal for Fear.
Posted on April 23, 2022 by Dr. David Edward Marcinko MBA MEd CMP™
By Staff Reporters
****
What a week in the world’s financial markets? It is perfect timing for this ME-P.
***
***
It is useful to look at stock market levels compared to where they’ve been over the past few months. When the S&P 500 is above its moving or rolling average of the prior 125 trading days, that’s a sign of positive momentum. But if the index is below this average, it shows investors are getting skittish.
The Fear & Greed Index uses slowing momentum as a signal for Fear and a growing momentum for Greed.
But, a few big stocks can skew returns for the market. So, it’s important to also know how many stocks are doing well versus those that are struggling.