MACD: Moving Average Convergence/Divergence

DEFINITION

Staff Reporters

SPONSOR: http://www.MarcinkoAssociates.com

***

***

From Wikipedia, the free encyclopedia

***


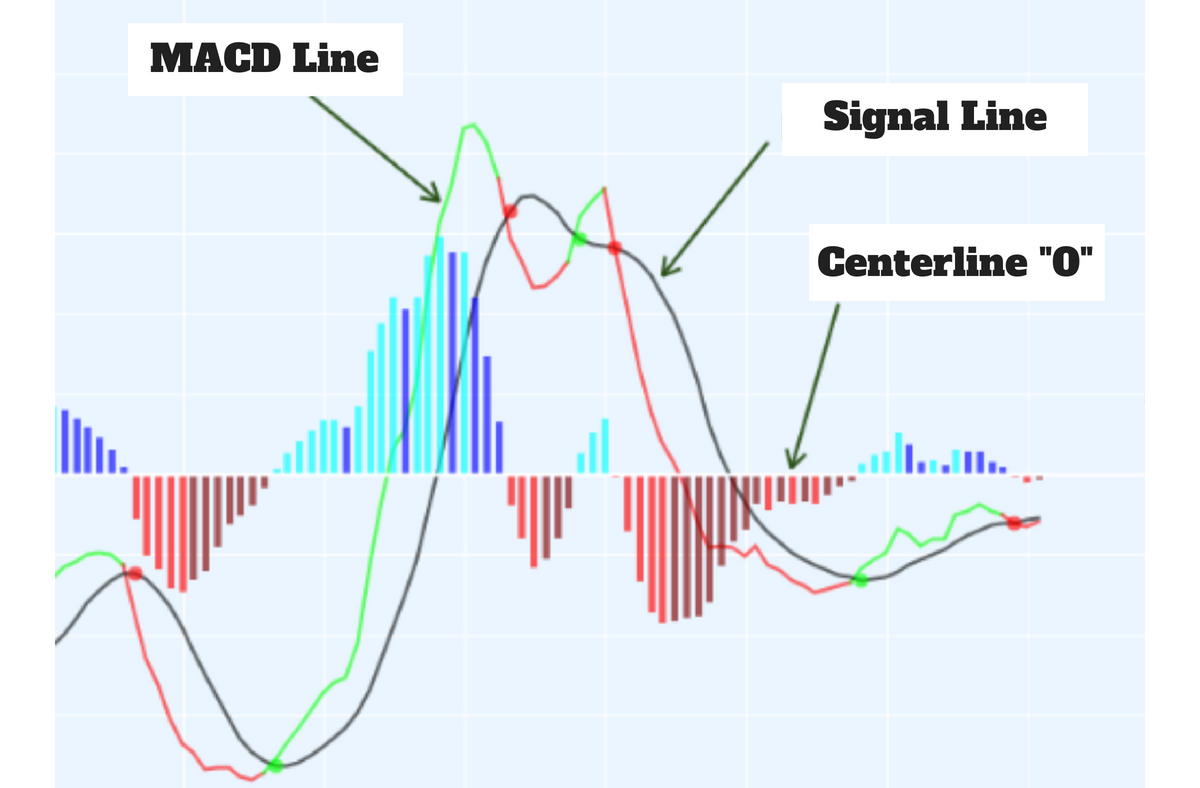
Example of historical stock price data (top half) with the typical presentation of a MACD(12,26,9) indicator (bottom half). The blue line is the MACD series proper, the difference between the 12-day and 26-day EMAs of the price. The red line is the average or signal series, a 9-day EMA of the MACD series. The bar graph shows the divergence series, the difference of those two lines.

***

MACD, short for moving average convergence/divergence, is a trading indicator used in technical analysis of securities prices, created by Gerald Appel in the late 1970s. It is designed to reveal changes in the strength, direction, momentum, and duration of a trend in a stock’s price.

The MACD indicator (or “oscillator”) is a collection of three time series calculated from historical price data, most often the closing price. These three series are: the MACD series proper, the “signal” or “average” series, and the “divergence” series which is the difference between the two. The MACD series is the difference between a “fast” (short period) exponential moving average (EMA), and a “slow” (longer period) EMA of the price series. The average series is an EMA of the MACD series itself.

The MACD indicator thus depends on three time parameters, namely the time constants of the three EMAs. The notation “MACD(a,b,c)” usually denotes the indicator where the MACD series is the difference of EMAs with characteristic times a and b, and the average series is an EMA of the MACD series with characteristic time c. These parameters are usually measured in days. The most commonly used values are 12, 26, and 9 days, that is, MACD (12,26,9). As true with most of the technical indicators, MACD also finds its period settings from the old days when technical analysis used to be mainly based on the daily charts. The reason was the lack of the modern trading platforms which show the changing prices every moment. As the working week used to be 6-days, the period settings of (12, 26, 9) represent 2 weeks, 1 month and one and a half week. Now when the trading weeks have only 5 days, possibilities of changing the period settings cannot be overruled. However, it is always better to stick to the period settings which are used by the majority of traders as the buying and selling decisions based on the standard settings further push the prices in that direction.

Although the MACD and average series are discrete values in nature, but they are customarily displayed as continuous lines in a plot whose horizontal axis is time, whereas the divergence is shown as a bar chart (often called a histogram).

***

MACD indicator showing vertical lines (histogram)

A fast EMA responds more quickly than a slow EMA to recent changes in a stock’s price. By comparing EMAs of different periods, the MACD series can indicate changes in the trend of a stock. It is claimed that the divergence series can reveal subtle shifts in the stock’s trend.

Since the MACD is based on moving averages, it is a lagging indicator. As a future metric of price trends, the MACD is less useful for stocks that are not trending (trading in a range) or are trading with unpredictable price action. Hence the trends will already be completed or almost done by the time MACD shows the trend.

COMMENTS APPRECIATED

EDUCATION: Books

Like, Subscribe and Refer

***

***

RSI: Relative Strength Index [Stock Markets]

By Staff Reporters

http://www.MARCINKOAssociates.com

***

***

The relative strength index (RSI) is a technical indicator used in the analysis of financial markets. It is intended to chart the current and historical strength or weakness of a stock or market based on the closing prices of a recent trading period. The indicator should not be confused with relative strength.

The RSI is classified as a momentum oscillator, measuring the velocity and magnitude of price movements. Momentum is the rate of the rise or fall in price. The relative strength RS is given as the ratio of higher closes to lower closes. Concretely, one computes two averages of absolute values of closing price changes, i.e. two sums involving the sizes of candles in a candle chart. The RSI computes momentum as the ratio of higher closes to overall closes: stocks which have had more or stronger positive changes have a higher RSI than stocks which have had more or stronger negative changes.

The RSI is most typically used on a 14-day time frame, measured on a scale from 0 to 100, with high and low levels marked at 70 and 30, respectively. Short or longer time frames are used for alternately shorter or longer outlooks. High and low levels—80 and 20, or 90 and 10—occur less frequently but indicate stronger momentum.

The relative strength index was developed by J. Welles Wilder and published in a 1978 book, New Concepts in Technical Trading Systems, and in Commodities magazine (now Modern Trader magazine) in the June 1978 issue. It has become one of the most popular oscillator indices.

The RSI provides signals that tell investors to buy when the security or currency is oversold and to sell when it is overbought.

RSI with recommended parameters and its day-to-day optimization was tested and compared with other strategies in Marek and Šedivá (2017). The testing was randomized in time and companies and showed that RSI can still produce good results; however, in longer time it is usually overcome by the simple buy-and-hold strategy.

***

***

COMMENTS APPRECIATED

Thank You

***

“ACTIVE” INVESTMENT STRATEGIES: For Physicians

And … why doctors are different?

By Dr. David Edward Marcinko MBA MEd CMP

SPONSOR: http://www.MarcinkoAssociates.com

By Dr. David Edward Marcinko MBA CMP

There are two distinct forms of financial analysis investment strategies often used by medical colleague investors who desire to pursue an active investment strategy.

Technical Analysis: Technical analysts, sometimes referred to as chartists, use historical price data and transaction volume data to identify mis-priced securities. A key belief shared by technical analysts is that stock prices follow recurring patterns and that once these historical patterns are identified, they can be used to identify future security prices. The heart of technical analysis is identifying significant shifts in the macro/micro economic supply and demand factors for a particular securities investment.

Skeptics of technical analysis generally subscribe to the notion that the markets efficiently and accurately price securities. In fact, the weak form of the Efficient Market Hypothesis [EMH] is based on the view that investors cannot consistently earn superior returns using historical data and technical analysis alone.

Fundamental Analysis: In contrast to technical analysis – which relies on historical market returns / transactions data – fundamental analysis focuses on the underlying company’s assets, earnings, risks, dividends and intrinsic security factors to identify mis-priced securities.

Furthermore, investors using fundamental analysis can use either a top-down or bottom-up approach:

  • The top-down investor starts with global economics, including both international and national economic indicators. These may include GDP growth rates, inflation, interest rates, exchange rates, productivity and energy prices. They subsequently narrow their search to regional / industry analysis of total sales, price levels, the effects of competing products, foreign competition and entry or exit from the industry. Often they refine their search to the best business in the area being studied.
  • The bottom-up investor starts with specific businesses, regardless of their industry / region, and proceeds in reverse of the top-down approach. Bottom-up investing is an approach that focuses on analyzing individual stocks and de-emphasizes the significance of macroeconomic and market cycles. In other words, bottom-up investing typically involves focusing on a specific company’s fundamentals, such as revenue or earnings, versus the industry or the overall economy. The bottom-up investing approach assumes individual companies can perform well even in an industry that is under performing, at least on a relative basis.

And so, a medical professional utilizing fundamental analysis is attempting to find securities that are trading at market prices below their intrinsic value. Skeptics suggest this is difficult or almost impossible to achieve.

Thus, while technical analysis focuses on market price history, a security’s intrinsic fundamental analysis is determined independent of the security’s market value. Of course, a combination of both fundamental and technical analysis can also be considered.

DOCTORS ARE DIFFERENT: https://marcinkoassociates.com/doctors-unique/

CMP: http://www.CertifiedMedicalPlanner.org

COMMENTS APPRECIATED

Thank You

***

***

What is a BOLLINGER BAND?

What Is a Bollinger Band®?

Courtesy: www.CertifiedMedicalPlanner.org

More on Technical Analysis

A Bollinger Band® is a technical analysis tool defined by a set of lines plotted two standard deviations (positively and negatively) away from a simple moving average of the security’s price, but can be adjusted to user preferences.

LINK: https://www.amazon.com/Dictionary-Health-Economics-Finance-Marcinko/dp/0826102549/ref=sr_1_6?ie=UTF8&s=books&qid=1254413315&sr=1-6

Bollinger Bands® were developed and copyrighted by the famous technical trader John Bollinger.

***

***

PODCAST: https://www.youtube.com/watch?v=13oogPJwWAM

Your thoughts are appreciated.

BUSINESS, FINANCE AND INSURANCE TEXTS FOR DOCTORS:

1 – https://lnkd.in/ebWtzGg

2 – https://lnkd.in/ezkQMfR

3 – https://lnkd.in/ewJPTJs

THANK YOU

Risk Management, Liability Insurance, and Asset Protection Strategies for Doctors and Advisors: Best Practices from Leading Consultants and Certified Medical Planners™8Comprehensive Financial Planning Strategies for Doctors and Advisors: Best Practices from Leading Consultants and Certified Medical Planners™

What is the “Ichimoku Cloud”?

No More “Candle Stick” Technical Stock Charts

[By Staff reporters]

The Ichimoku Cloud is a collection of technical indicators that show support and resistance levels, as well as momentum and trend direction. It does this by taking multiple averages and plotting them on the chart. It also uses these figures to compute a “cloud” which attempts to forecast where the price may find support or resistance in the future.

***

***
***
***