What is the “GINI” Statistical Diversion Index?

What it is – How it works?

[By Staff reporters]

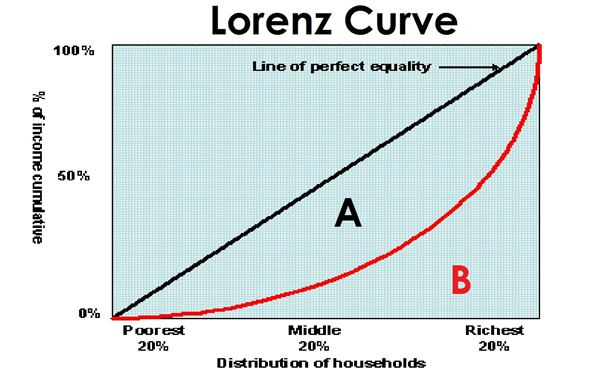
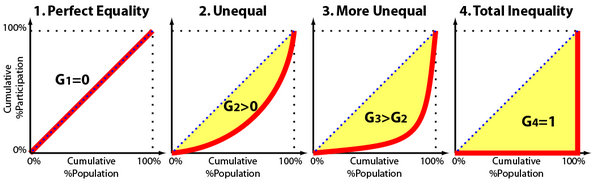
The Gini Coefficient (also known as the Gini index or Gini ratio) is a measure of statistical dispersion intended to represent the income distribution of a nation’s residents, and is the most commonly used measure of inequality.

It is related to the Lorenz Curve and was developed by the Italian statistician and sociologist Corrado Gini and published in his 1912 paper Variability and Mutability.

***


***

MORE: About the Lorenz Curve

MORE: https://www.investopedia.com/terms/g/gini-index.asp

Assessment

Recently, the Gini Index has been in the Atlanta, Georgia news; and not in a good way. Learn why here?

ATLANTA: https://www.bloomberg.com/news/articles/2018-10-10/atlanta-takes-top-income-inequality-spot-among-american-cities

Conclusion

Your thoughts and comments on this ME-P are appreciated. Feel free to review our top-left column, and top-right sidebar materials, links, URLs and related websites, too. Then, subscribe to the ME-P. It is fast, free and secure.

Speaker: If you need a moderator or speaker for an upcoming event, Dr. David E. Marcinko; MBA – Publisher-in-Chief of the Medical Executive-Post – is available for seminar or speaking engagements.

Book Marcinko: https://medicalexecutivepost.com/dr-david-marcinkos-bookings/

Subscribe: MEDICAL EXECUTIVE POST for curated news, essays, opinions and analysis from the public health, economics, finance, marketing, IT, business and policy management ecosystem.

DOCTORS:

“Insurance & Risk Management Strategies for Doctors” https://tinyurl.com/ydx9kd93

“Fiduciary Financial Planning for Physicians” https://tinyurl.com/y7f5pnox

“Business of Medical Practice 2.0” https://tinyurl.com/yb3x6wr8

HOSPITALS:

“Financial Management Strategies for Hospitals” https://tinyurl.com/yagu567d

“Operational Strategies for Clinics and Hospitals” https://tinyurl.com/y9avbrq5

***

Risk Management, Liability Insurance, and Asset Protection Strategies for Doctors and Advisors: Best Practices from Leading Consultants and Certified Medical Planners™8Comprehensive Financial Planning Strategies for Doctors and Advisors: Best Practices from Leading Consultants and Certified Medical Planners™

About the Lorenz Curve

What it is – How it works
By staff reporters

HISTORY:

The Lorenz curve is a graphical representation of income inequality or wealth inequality developed by American economist Max Lorenz in 1905.

DEFINITION:

The graph plots percentiles of the population according to income or wealth on the horizontal axis. It plots cumulative income or wealth on the vertical axis, so that an x-value of 45 and a y-value of 14.2 would mean that the bottom 45% of the population controls 14.2% of the total income or wealth. http://www.HealthDictionarySeries.org

***

***

USE:

The concept is useful in describing inequality among the size of individuals in ecology and in studies of biodiversity, where the cumulative proportion of species is plotted against the cumulative proportion of individuals.

It is also useful in business modeling: e.g., in consumer finance, to measure the actual percentage y% of delinquencies attributable to the x% of people with worst risk scores.

MORE: https://www.investopedia.com/terms/l/lorenz-curve.asp

Conclusion

Your thoughts and comments on this ME-P are appreciated. Feel free to review our top-left column, and top-right sidebar materials, links, URLs and related websites, too. Then, subscribe to the ME-P. It is fast, free and secure.

Speaker: If you need a moderator or speaker for an upcoming event, Dr. David E. Marcinko; MBA – Publisher-in-Chief of the Medical Executive-Post – is available for seminar or speaking engagements. https://medicalexecutivepost.com/dr-david-marcinkos-bookings/

Contact: MarcinkoAdvisors@msn.com

***

https://www.crcpress.com/Comprehensive-Financial-Planning-Strategies-for-Doctors-and-Advisors-Best/Marcinko-Hetico/p/book/9781482240283