


![]()
More on the CPI
By Rick Kahler MS CFP® ChFC CCIM www.KahlerFinancial.com
 With all the talk recently, about tax rates and the fiscal cliff, hardly anyone has mentioned what is probably the most effective and least understood tax in the federal arsenal: inflation.
Wait a minute. Isn’t it confusing to call inflation a tax? It is. That confusion is exactly why inflation is the ultimate stealth tax.
The CPI Formula
One of the few deficit-reducing measures that had the support of both parties and President Obama is a change in the way the government measures inflation. Our lawmakers have agreed on another in a series of adjustments to the way they calculate the consumer price index (CPI). The proposed changes will understate the future CPI even more than the current formula already does.
This maneuver is a brilliant way for deficit-reducing lawmakers to both cut spending and increase taxes, without calling their action either a spending cut or a tax increase.
The “Chained” CPI
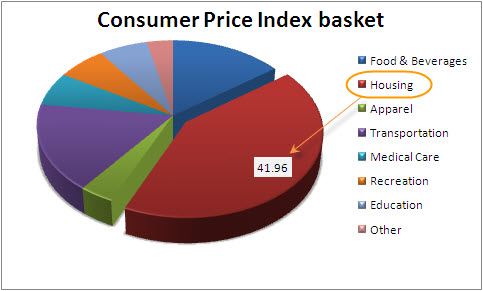
How is this possible? First, here’s a brief explanation of the proposed change, which is called the chained Consumer Price Index. According to an AP article published in the Rapid City Journal on December 5th, 2012, “the chained CPI assumes that as prices rise, consumers turn to lower-cost alternatives, reducing the amount of inflation they experience.”
The assumption is that, if the price of pork rises while chicken doesn’t, people will buy more chicken. Yet they’re still buying protein. Therefore, presto—no inflation has happened. This argument is like saying if the price of gasoline goes up and the cost of walking doesn’t, people will just walk more, so there’s no problem.
A Spending Cut
The chained CPI is a spending cut because many entitlement programs are indexed to the CPI. These include Social Security, government pensions, veterans benefits, and the interest on some of the national debt. The lower the increase in the CPI; the less benefits will rise.
The AP estimates that once the new CPI is fully phased in, a 65-year old on Social Security will receive $136 a year less. At age 75 the reduction will be $560 annually, and at 85 it will be $984 less.
In addition, as wages increase at the real inflation rate, entitlement programs won’t keep pace. Gradually, fewer people will be eligible for programs like food stamps, Medicaid, heating allowances, and Head Start.
###
A Tax Increase
The chained CPI is a tax increase for much the same reason. Many income tax brackets and deductions are indexed to inflation. Smaller annual adjustments to the brackets because of the lower CPI will push more people into higher tax brackets.
Tweaking the CPI is nothing new. Politicians from both parties have done so for years to give the illusion of a lower CPI than that calculated by previous methods.
ShadowStats.com, run by John Williams, calculates the current unemployment and inflation rates using the formulas from the 1980s. According to that methodology, the unemployment rate (U-6) is 15% and the CPI is 9%. Yet the government has tweaked the CPI so much that today the official CPI is 2.5%. Under this newest proposal, inflation would be 2.2%.
The Results
You may think understating the current CPI by 0.3% isn’t any big deal, but it is. The decrease represents a 12% drop in the inflation rate, which understates the increase in our cost of living. If your employer reduced your wages by 12%, you’d probably see it as a big deal.
Assessment
Proponents figure the newest CPI adjustment will save $200 billion in spending increases and raise $65 billion in new taxes over ten years. It doesn’t matter whether you call it inflation, chained CPI, or plain old gimmickry. A tax increase by any other name is still a tax increase.
Macro-Economics and What the ‘Chained CPI’ Could Mean for Social Security?
Conclusion
Your thoughts and comments on this ME-P are appreciated. Feel free to review our top-left column, and top-right sidebar materials, links, URLs and related websites, too. Then, subscribe to the ME-P. It is fast, free and secure.
Link: http://feeds.feedburner.com/HealthcareFinancialsthePostForcxos
Speaker: If you need a moderator or speaker for an upcoming event, Dr. David E. Marcinko; MBA – Publisher-in-Chief of the Medical Executive-Post – is available for seminar or speaking engagements. Contact: MarcinkoAdvisors@msn.com
Our Other Print Books and Related Information Sources:
Health Dictionary Series: http://www.springerpub.com/Search/marcinko
Practice Management: http://www.springerpub.com/product/9780826105752
Physician Financial Planning: http://www.jbpub.com/catalog/0763745790
Medical Risk Management: http://www.jbpub.com/catalog/9780763733421
Hospitals: http://www.crcpress.com/product/isbn/9781439879900
Physician Advisors: www.CertifiedMedicalPlanner.org
![]()
![]()
Share this:

Filed under: Taxation | Tagged: Consumer Price Index, CPI, Inflation Tax, John Williams, rick kahler, unchained CPI, www.ShadowStats.com | 1 Comment »


