TRANSACTIONAL STOCK ANALYSIS: What Is It?

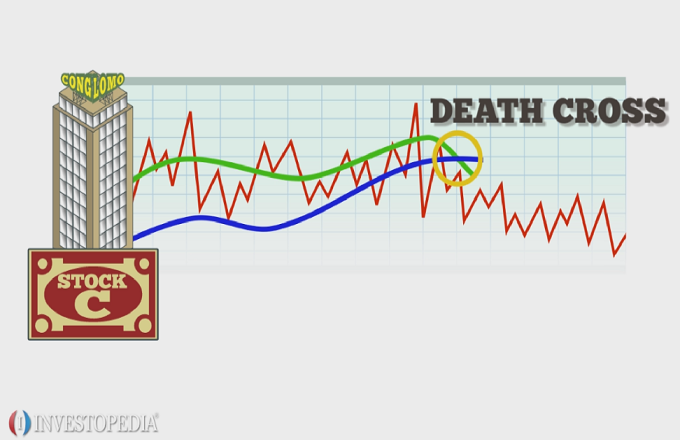
Versus Technical Analysis

By Staff Reporters

***

***

In traditional finance transaction data is guarded by exchanges, brokers, banks and regulators. It’s not accessible to everyone and big players pay a fortune for it.

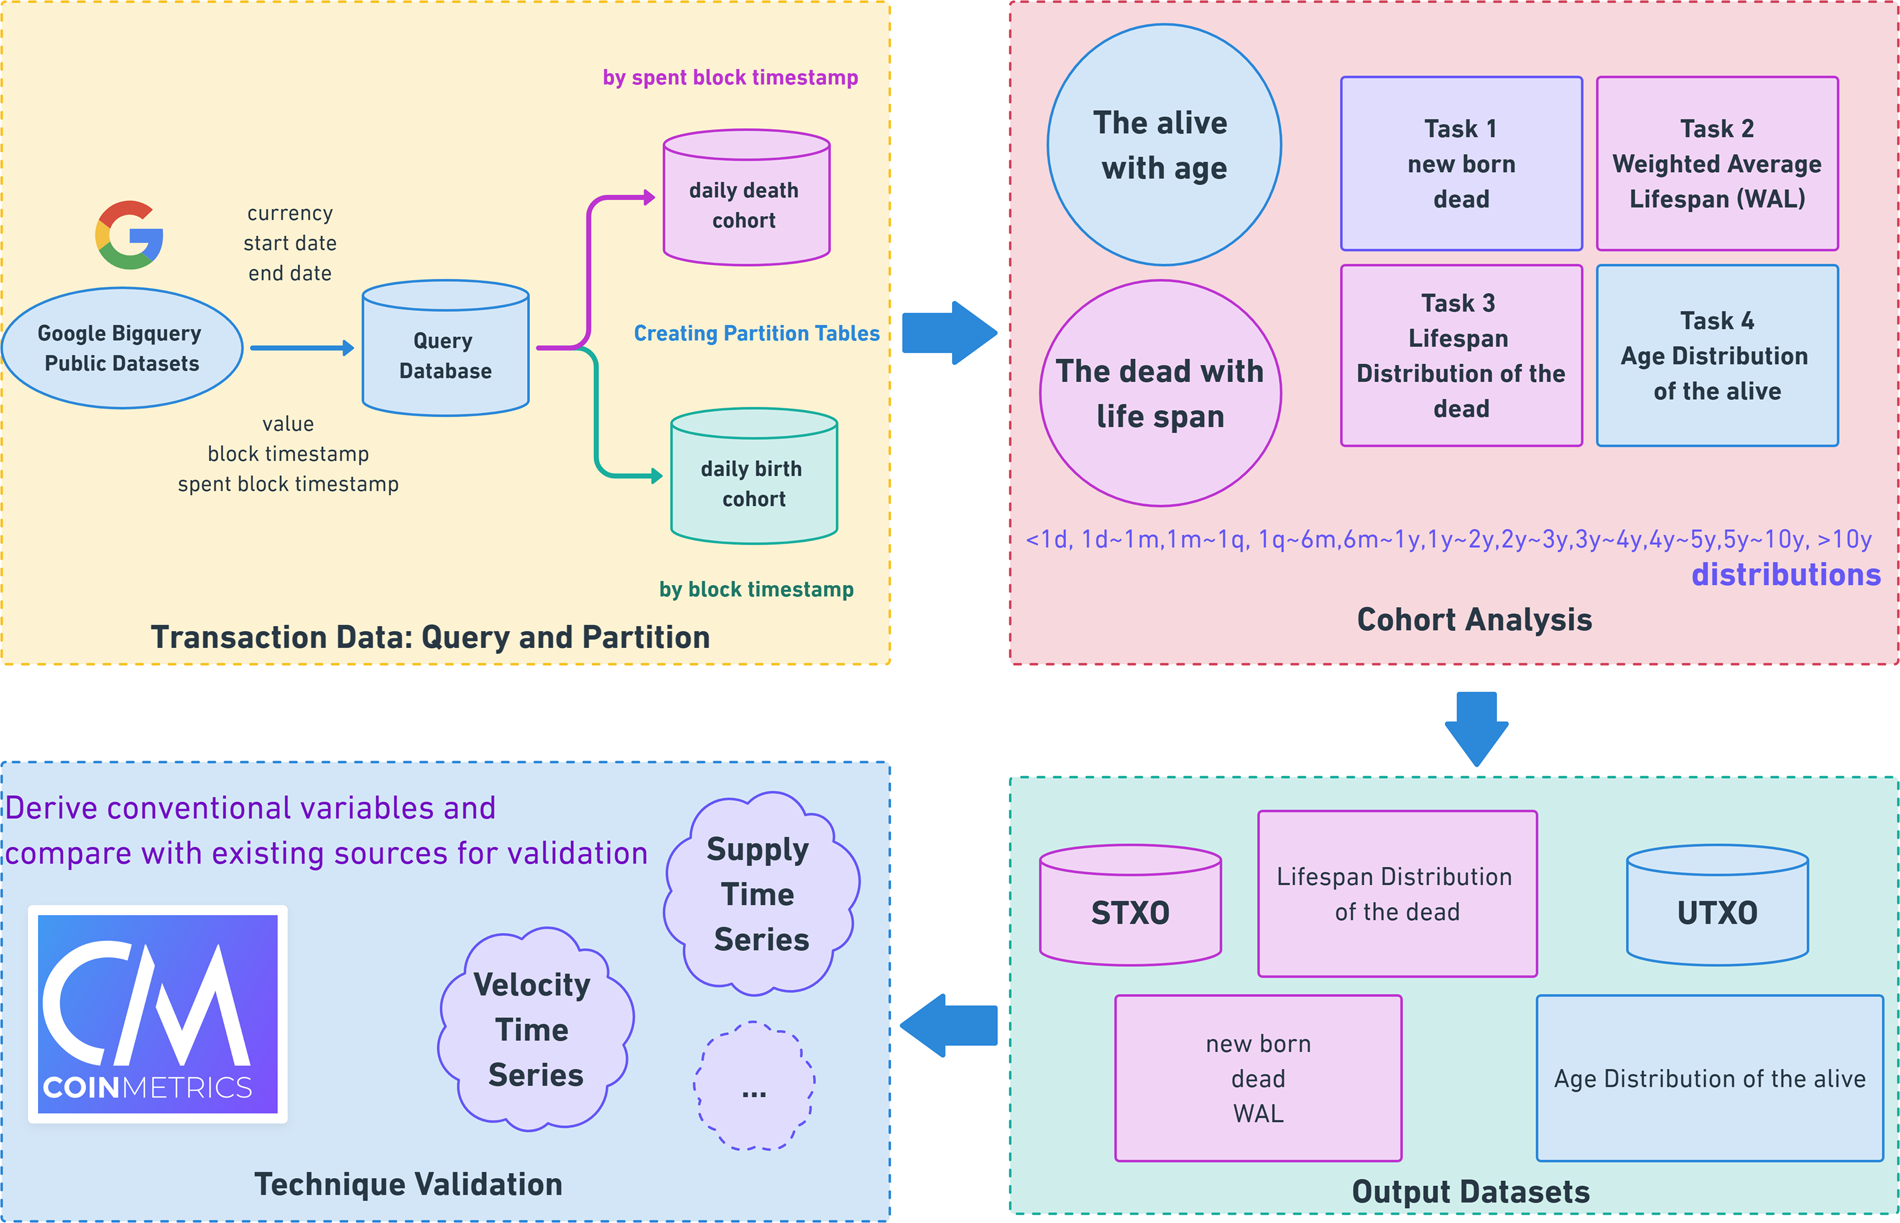
But, in crypto, Transaction Data is public and on-chain – but it’s not usable by everyone. So, manually making sense of raw blockchain data is practically impossible. The data needs to be processed and analyzed to be made useful. That’s what sophisticated blockchain analytics tools are doing.

The combination of on-chain data and transaction analysis is something that hasn’t been before – in crypto or traditional finance. Getting access to transaction data and tools for searching and analyzing it will unlock a goldmine of potential insight.

People who have been on the inside of projects and see how the sausage is made know that the explanations for price movements are often simple and based on key players buying and selling. When the biggest holders are dumping the price is likely to go down. When a major new buyer takes a position prices are likely to go up.

That’s insight traditional Technical Analysis cannot provide, because it’s limited to looking at price movements. Transaction data, instead, is the underlying activity that generates prices in crypto.

CITE: https://www.r2library.com/Resource/Title/0826102549

Technical Analysis: https://medicalexecutivepost.com/2022/06/23/the-technicians/

Related: https://medicalexecutivepost.com/2022/09/25/what-is-sentimental-stock-market-analysis/

***

ORDER: https://www.amazon.com/Dictionary-Health-Information-Technology-Security/dp/0826149952/ref=sr_1_5?ie=UTF8&s=books&qid=1254413315&sr=1-5

ORDER MORE: : https://www.amazon.com/Financial-Management-Strategies-Healthcare-Organizations/dp/1466558733/ref=sr_1_3?ie=UTF8&qid=1380743521&sr=8-3&keywords=david+marcinko

***

COMMENTS APPRECIATED

Thank You

****

What is the Stock Market DEATH CROSS?

Is A Market Downside Ahead?

By Staff Reporters

***

Charles Schwab: The stock is about to form a death cross pattern as the 200-day and 50-day moving averages are about to cross each other. If this pattern forms, there are signs that the stock will continue falling as sellers target the key support at $60.8, its lowest point this month. A break above that level will see it drop to the psychological support at $55.

***

What Is a Death Cross?

The death cross is a technical chart pattern indicating the potential for a major sell-off. The death cross appears on a chart when a stock’s short-term moving average crosses below its long-term moving average. Typically, the most common moving averages used in this pattern are the 50-day and 200-day moving averages.

***

LINK: https://medicalexecutivepost.com/2022/02/09/what-is-a-bear-market-relief-rally/

CITE: https://www.r2library.com/Resource/Title/082610254

***

***

Summary:

  • The death cross is a bearish signal that’s issued when the short term moving average penetrates the falling long term moving average from above.
  • The most common settings for the averages are 50 and 200.
  • The death cross is a lagging indicator, which should be taken into consideration before relying on it for your own investments.

COMMENTS APPRECIATED

Thank You

Subscribe to the Medical Executive-Post

***

***

FINANCE: https://www.amazon.com/Comprehensive-Financial-Planning-Strategies-Advisors/dp/1482240289/ref=sr_1_1?ie=UTF8&qid=1418580820&sr=8-1&keywords=david+marcinko

***

DAILY UPDATE: Stock Markets Drop!

MEDICAL EXECUTIVE-POST TODAY’S NEWSLETTER BRIEFING

***

Essays, Opinions and Curated News in Health Economics, Investing, Business, Management and Financial Planning for Physician Entrepreneurs and their Savvy Advisors and Consultants

Serving Almost One Million Doctors, Financial Advisors and Medical Management Consultants Daily

A Partner of the Institute of Medical Business Advisors , Inc.

http://www.MedicalBusinessAdvisors.com

SPONSORED BY: Marcinko & Associates, Inc.

***

http://www.MarcinkoAssociates.com

Daily Update Provided By Staff Reporters Since 2007.
How May We Serve You?
© Copyright Institute of Medical Business Advisors, Inc. All rights reserved. 2024

REFER A COLLEAGUE: MarcinkoAdvisors@msn.com

SPONSORSHIPS AVAILABLE: https://medicalexecutivepost.com/sponsors/

ADVERTISE ON THE ME-P: https://tinyurl.com/ytb5955z

Your Referral Count -0-

CITE: https://www.r2library.com/Resource

What’s up

  • Zoom Video Communications zoomed 12.97% higher after beating earnings estimates and raising its revenue forecast for the year.
  • Crocs gained 1.04% after Williams Trading upgraded the company from Hold to Buy and boosted its price target to $163 from $135.
  • Deutsche Bank climbed 3.38% thanks to an announcement that it has reached a settlement with the majority of plaintiffs in its long-running case regarding its Postbank acquisition a decade ago.
  • Paramount Global rose 0.81% after its special committee extended its “go shop” period ahead of its potential merger with Skydance.

What’s down

  • Advance Auto Parts plummeted 17.47% thanks to a massive earnings miss this quarter and management’s prediction that earnings will drop for the rest of the year.
  • Nvidia fell 3.70% after it came to light that investors and insiders like CEO Jensen Huang keep selling their shares of the company.
  • Charles Schwab dropped 0.46% after TD Bank announced it will sell part of its stake in the company to cover recent fines.
  • Williams-Sonoma sank 9.21% due to a poor earnings report as consumers slow their spending with the home goods retailer.
  • Wolfspeed declined 5.38% after the chipmaker revealed that slowing EV sales had hurt its bottom line and that it’s closing one of its manufacturing plants to cut costs.

CITE: https://tinyurl.com/2h47urt5

Here’s where the major benchmarks ended:

  • The S&P 500 index (SPX) lost 50.21 points (–0.89%) to 5,570.64; the Dow Jones Industrial Average® ($DJI) fell 177.71 points (–0.43%) to 40,712.78; the NASDAQ Composite®($COMP) dropped 299.63 points (–1.67%) to 17,619.35. 
  • The 10-year Treasury note yield rose about eight basis points to 3.86%, roughly the midpoint of its recent range.
  • The CBOE Volatility Index® (VIX) climbed moderately to 17.66, the highest close since August 13.

CITE: https://tinyurl.com/tj8smmes

COMMENTS APPRECIATED

PLEASE SUBSCRIBE: MarcinkoAdvisors@msn.com

Thank You

***

***

***

***

EDUCATIONAL TEXTBOOKS: https://tinyurl.com/4zdxuuwf

***