


SELL IN MAY – AND GO AWAY
By Staff Reporters
***
***
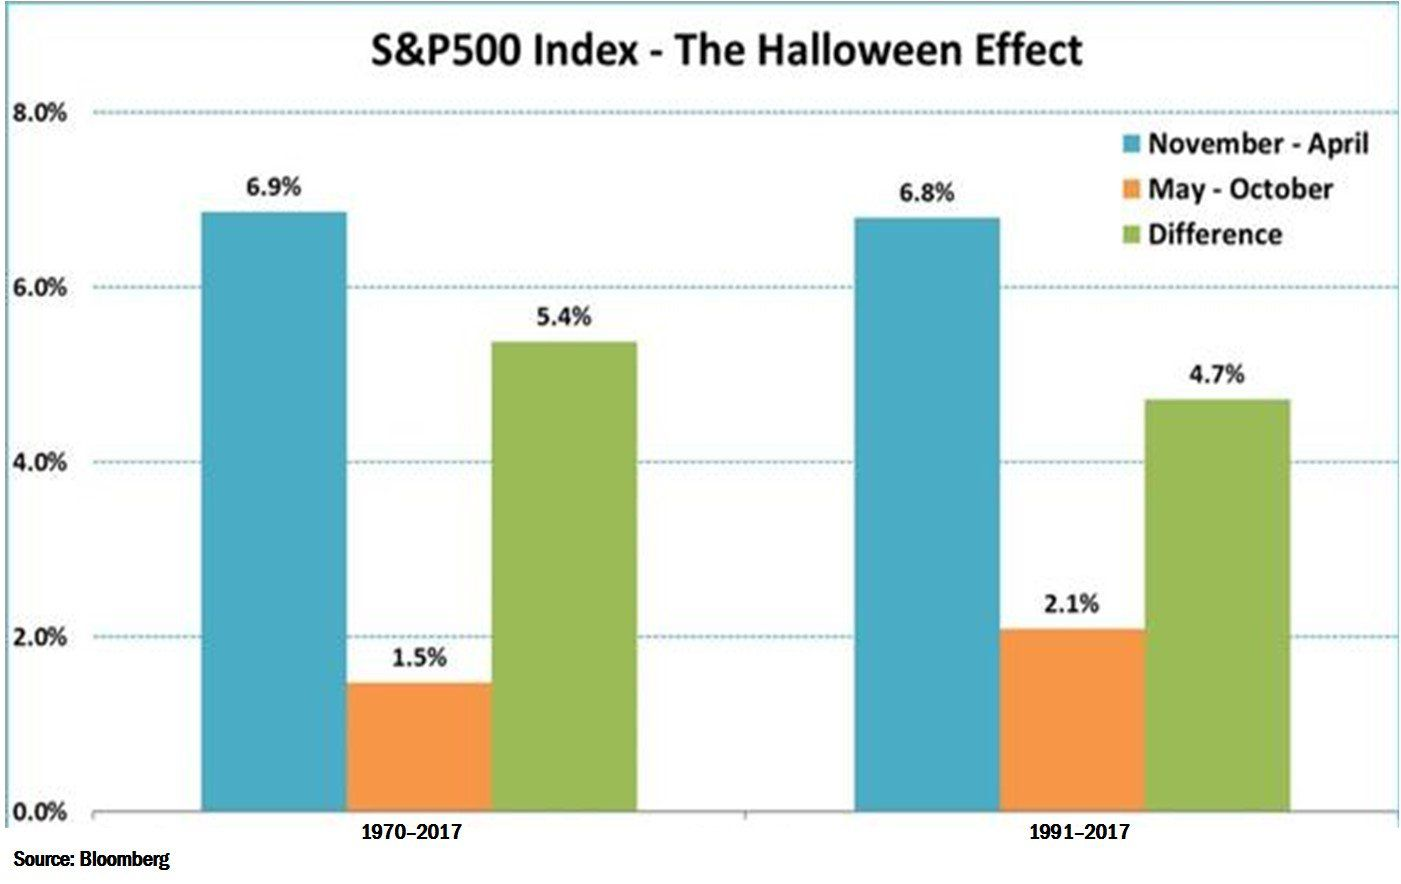
Essentially, the HALLOWEEN INDICATOR is a market-timing strategy. It argues that, by buying into the stock market after Halloween and selling at the end of April, investors would generate a better annual return on their portfolio than if they had remained invested throughout the year. Sell in May and go away is an investment strategy for stocks based on a theory that the period from November to April inclusive has significantly stronger stock market growth on average than the other months
The practice of abandoning stocks beginning in May of each year is widely thought to have its origins in the United Kingdom. The privileged class would leave London and head to their country estates for the summer months, where they would largely ignore their investment portfolios. To this day, many stock market watchers have postulated that the corresponding impact of summer vacations on market liquidity and investors’ risk aversion is at least partly responsible for the difference in seasonal returns.
In what is considered to be a seminal piece of research on the subject, “The Halloween Indicator, ‘Sell in May and Go Away’: Another Puzzle,” authors Sven Bouman and Ben Jacobsen were among the first to document a strong seasonal effect in global stock markets. In 36 of the 37 developed and emerging markets they studied between 1973 and 1998, the authors found returns in the November through April period to be, on average, significantly higher than those in the May through October period, even after taking transaction costs into account. What puzzled the authors was the fact that, while the anomaly was widely known and seemed to offer considerable economic rewards, it had not been arbitraged away.
More recently, Jacobsen partnered with Cherry Zhang on a follow up study, titled, “The Halloween Indicator: Everywhere and All the Time,” and extended the research to 108 stock markets using all historical data available. The result was a sample of 55,425 monthly observations (including more than 300 years of UK data), which helped to rebut any criticisms of data mining and sample selection bias. The results were compelling, as the November through April “winter” period delivered returns that were, on average, 4.52% higher than the “summer” returns. The Halloween effect was evident in 81 out of 108 countries. The size of the Halloween effect varied across geographies. It was found to be stronger in developed and emerging markets than in frontier markets.
***
MORE: https://medicalexecutivepost.com/2021/10/30/the-halloween-index-investment-strategy/
COMMENTS APPRECIATED
Thank You
***

***
***
Share this:

Filed under: "Ask-an-Advisor", Financial Planning, iMBA, Inc., Investing | Tagged: halloween, Halloween Index, HALLOWEEN: Stock Index Indicator?, Stock Index Indicator? |

Leave a comment