


What it is – How it works?
[By Staff reporters]
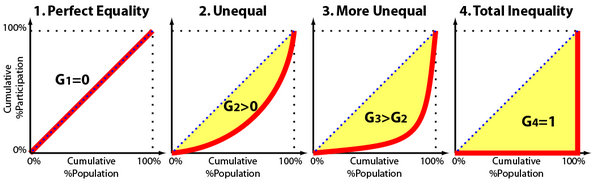
The Gini Coefficient (also known as the Gini index or Gini ratio) is a measure of statistical dispersion intended to represent the income distribution of a nation’s residents, and is the most commonly used measure of inequality.
It is related to the Lorenz Curve and was developed by the Italian statistician and sociologist Corrado Gini and published in his 1912 paper Variability and Mutability.
***
***
MORE: https://www.investopedia.com/terms/g/gini-index.asp
Assessment
Recently, the Gini Index has been in the Atlanta, Georgia news; and not in a good way. Learn why here?
Conclusion
Your thoughts and comments on this ME-P are appreciated. Feel free to review our top-left column, and top-right sidebar materials, links, URLs and related websites, too. Then, subscribe to the ME-P. It is fast, free and secure.
Speaker: If you need a moderator or speaker for an upcoming event, Dr. David E. Marcinko; MBA – Publisher-in-Chief of the Medical Executive-Post – is available for seminar or speaking engagements.
Book Marcinko: https://medicalexecutivepost.com/dr-david-marcinkos-bookings/
Subscribe: MEDICAL EXECUTIVE POST for curated news, essays, opinions and analysis from the public health, economics, finance, marketing, IT, business and policy management ecosystem.
DOCTORS:
“Insurance & Risk Management Strategies for Doctors” https://tinyurl.com/ydx9kd93
“Fiduciary Financial Planning for Physicians” https://tinyurl.com/y7f5pnox
“Business of Medical Practice 2.0” https://tinyurl.com/yb3x6wr8
HOSPITALS:
“Financial Management Strategies for Hospitals” https://tinyurl.com/yagu567d
“Operational Strategies for Clinics and Hospitals” https://tinyurl.com/y9avbrq5
***
 8
8
Share this:

Filed under: "Ask-an-Advisor", Ethics, Health Economics, LifeStyle | Tagged: corrado gini, gini coefficient, gini index, Gini ratio, Lorenz curve |

GINI INDEX
It’s a summary statistic, like an average. As such, it can be both very insightful and very one-dimensional. The old statistician’s joke, “The average American has one breast and one testicle,” reveals both the insightful nature of an average (approximately same number of males and females) and its unidimensionality. Of course, smart analysts solve this by having an array of data to put the Gini into context.
Think of statistical indices like the Gini as being a recipe. The absolute proportions of the ingredients are what really count in a recipe–proportion of flour to baking soda, for example. This makes it easy to make a recipe for one or a million cookies. Just like a recipe, you’ve chosen to include certain ingredients (data) and exclude others. This doesn’t necessarily make one recipe (index) superior or inferior to another–you choose what dish you’re trying to make based upon your purposes and the results of interest. And sometimes you can swap ingredients with relative ease, like dark chocolate chips vs. semi-sweet in your cookies, without significantly changing the fact that you’re baking cookies. In other words, when using any index, be cognizant of what data it includes, and be aware that it’s a relative measure–trying to guess how many cookies were in the batch by tasting a single cookie is crazy, but it’s amazing how many people use relative indices like the Gini to reverse engineer a narrative. You need more than just this one number.
Compare relative indices like the Gini to an absolute index like US GDP. GDP is like the measure of volume, so that you know how many pounds the flour and other ingredients add up to. Of course, GDP also includes anything that accidentally falls into the mixing bowl, and you can sure bet that where rewards incur as the result of more GDP that some low quality but heavy items get tossed in. Just look at any industry where re-work is common such as health care, car repair, etc. Re-doing a job adds to the GDP, unless you subtract the amount of re-work and waste, or have a measure of an objective desired outcome to create a ratio.
Of course, politicians and the press seldom make their sound bytes based on the nuances of a complete comparative analysis–“Inequality at All-Time High” grabs attention much more effectively than, “One Index Indicates Inequality at All-Time High Yet Another Indicates that Most Inequality is in a Certain Sub-Population that Has Become Economically Stagnated.” Whenever reading a stark headline that seems to leave no room for doubt, it’s usually good advice to find an impartial think-tank or government office with more detailed data to understand the context, as that’s what needs influenced by decisions, policy, and resource investments.
Mike Gravier PhD
LikeLike
The GI
The Gini coefficient (also known as the Gini index or Gini ratio) is a measure of statistical dispersion intended to represent the income distribution of a nation’s residents, and is the most commonly used measure of inequality. It was developed by the Italian statistician and sociologist Corrado Gini and published in his 1912 paper Variability and Mutability.
Klaus
LikeLike