


In Healthcare
***
***
Conclusion
Your thoughts and comments on this ME-P are appreciated. Feel free to review our top-left column, and top-right sidebar materials, links, urls and related websites, too. Then, subscribe to the ME-P. It is fast, free and secure.
Speaker: If you need a moderator or speaker for an upcoming event, Dr. David E. Marcinko; MBA – Publisher-in-Chief of the Medical Executive-Post – is available for seminar or speaking engagements.
Contact: MarcinkoAdvisors@msn.com
Subscribe: MEDICAL EXECUTIVE POST for curated news, essays, opinions and analysis from the public health, economics, finance, marketing, I.T, business and policy management ecosystem.
Share this:

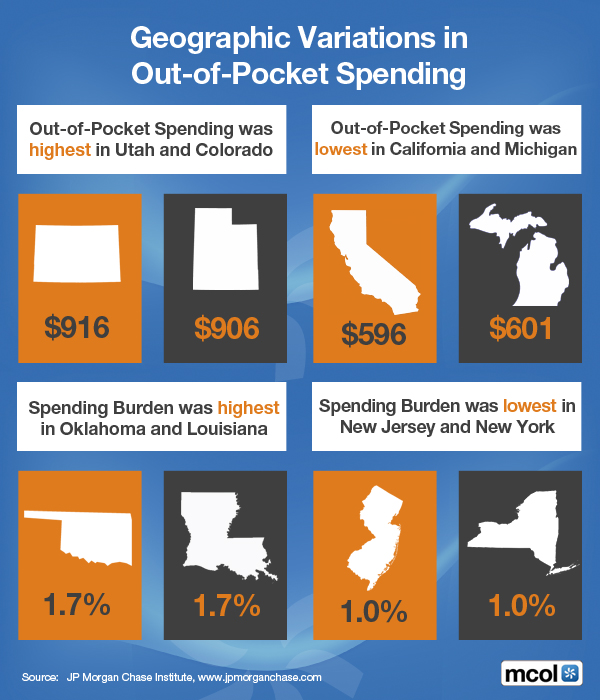
Filed under: Health Economics, Health Insurance | Tagged: Geographic Variations in Out-of-Pocket Spending, www.MCOL.com |

10.6% of Total Health Spending Was Out-Of-Pocket in 2016
The California Health Care Foundation recently published an analysis of US healthcare spending. Here are some key findings on health spending distribution from the report:
• Private health insurance paid for one third of total health spending in 2016.
• Medicare paid for 20.1% of total health spending in 2016.
• Medicaid paid for 16.9% of total health spending in 2016.
• 10.6% of total health spending in 2016 was out-of-pocket.
Source: California Health Care Foundation, May 2018
LikeLike