ME-P SYNDICATIONS:
WSJ.com,
CNN.com,
Forbes.com,
WashingtonPost.com,
BusinessWeek.com,
USNews.com, Reuters.com,
TimeWarnerCable.com,
e-How.com,
News Alloy.com,
and Congress.org


BOARD CERTIFICATION EXAM STUDY GUIDES
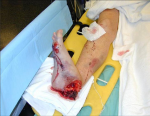
Lower Extremity Trauma
[Click on Image to Enlarge]
The “Medical Executive-Post” is about connecting doctors, health care executives and modern consulting advisors. It’s about free-enterprise, business, practice, policy, personal financial planning and wealth building capitalism. We have an attitude that’s independent, outspoken, intelligent and so Next-Gen; often edgy, usually controversial. And, our consultants “got fly”, just like U. Read it! Write it! Post it! “Medical Executive-Post”. Call or email us for your FREE advertising and sales consultation TODAY [770.448.0769]


ePodiatryConsentForms.com
Suite #5901 Wilbanks Drive, Norcross, Georgia, 30092 USA [1.770.448.0769]. Our location is real and we are now virtually enabled to assist new long distance clients and out-of-town colleagues.
If you want the opportunity to work with leading health care industry insiders, innovators and watchers, the “ME-P” may be right for you? We are unbiased and operate at the nexus of theoretical and applied R&D. Collaborate with us and you’ll put your brand in front of a smart & tightly focused demographic; one at the forefront of our emerging healthcare free marketplace of informed and professional “movers and shakers.” Our Ad Rate Card is available upon request [770-448-0769].

“Providing Management, Financial and Business Solutions for Modernity”
Whether you’re a mature CXO, physician or start-up entrepreneur in need of management, financial, HR or business planning information on free markets and competition, the "Medical Executive-Post” is the online place to meet for Capitalism 2.0 collaboration.

Support our online development, and advance our onground research initiatives in free market economics, as we seek to showcase the brightest Next-Gen minds.
THE ME-P DISCLAIMER: Posts, comments and opinions do not necessarily represent iMBA, Inc., but become our property after submission. Copyright © 2006 to-date. iMBA, Inc allows colleges, universities, medical and financial professionals and related clinics, hospitals and non-profit healthcare organizations to distribute our proprietary essays, photos, videos, audios and other documents; etc. However, please review copyright and usage information for each individual asset before submission to us, and/or placement on your publication or web site. Attestation references, citations and/or back-links are required. All other assets are property of the individual copyright holder.


Medicare Expenditures For 2014-2019 Will Be $4.3 Trillion
The Robert Wood Johnson Foundation recently released a report on health care spending growth trends. Here are some key findings:
• National health expenditures (NHE) grew 3.6% per year between 2009 and 2013.
• NHE grew 4.3% annually from 2010 to 2015.
• Medicare expenditures for 2014 to 2019 are projected to be $4.3 trillion.
• Private insurance expenditures for 2014-2019 are projected to be $7 trillion.
• NHE per capita is projected to increase 4.6% per year from 2014-2019.
• Medicaid enrollment is expected to increase by 2.7%.
Source: Robert Wood Johnson Foundation, May 2017
LikeLike
Medicare Accounted For 15% of Total Federal Spending in 2016
Kaiser Family Foundation recently released an analysis Medicaid spending. Here are some key findings from the report:
• Medicare accounted for 15% of total federal spending in 2016.
• Medicare spending is projected to rise to 17.5% by 2027.
• The Medicare Hospital Insurance trust fund will be depleted in 2029.
• The Independent Payment Advisory Board process will be triggered in 2021.
• Annual growth in Medicare per capita spending was 1.3% between 2010 and 2016.
• Per capita spending is projected to grow 4.5% annually over the next 10 years.
Source: Kaiser Family Foundation, July 18, 2017
LikeLike
Families Spent 1.6% of Income Out-of-Pocket on Healthcare in 2016
JPMorgan Chase Institute recently released an analysis on out-of-pocket healthcare spending. Here are some key findings from the report:
• Families spent $714 or 1.6% of their income out-of-pocket on healthcare in 2016.
• Out-of-pocket spending grew by an average annual rate of 4.3% from 2013-2016.
• 55% of out-of-pocket spending went to doctors, dentists, and hospitals.
• Out-of-pocket spending among top income-quintile account holders was $1,322.
• 52% of families made payments to doctors’ offices in a given year.
• Spending among lowest income-quintile account holders was $356 on average in 2016.
Source: JPMorgan Chase Institute, September 2017
LikeLike
17% of Families Had No Out-of-Pocket Healthcare Spending in 2016
Kaiser Family Foundation and the Health Research & Educational Trust recently released their 2017 Employer Health Benefits Survey. Here are some key findings from the report:
• The top 10% of spenders contributed 49% of total out-of-pocket spending in 2016.
• The average family in the top 10% spent $3,482 in 2016.
• The average family in the top 5% spent $4,592 out-of-pocket in 2016.
• 17% of families had no out-of-pocket healthcare spending in 2016.
• The top 10% of spenders spent 8.5% of their income on healthcare services.
• The top 5% of spenders spent 12.3% of their income on healthcare expenses.
Source: 2017 Employer Health Benefits Survey, September 19, 2017
LikeLike